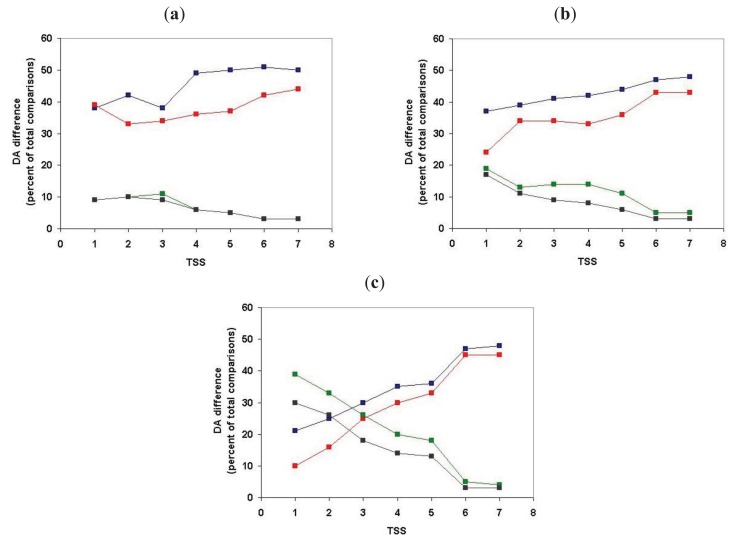
Figure 10.
Analysis of the positional distribution of DA differences of paralogous human Swiss-Prot sequences differing in single domains. The numbers on the abscissa indicate the number of top-scoring matches included in the analyses (TSS = 1, …. TSS = 7) used to define paralogous clusters. N-terminal differences (blue recrangles), C-terminal differences (red rectangles), internal differences (green rectangles), tandem duplications (black rectangles). (a) Positional distribution of DA differences for type 1 transitions; (b) Positional distribution of DA differences for type 2 transitions (note that, in the case of the closest paralogs (TSS = 1), the proportion of terminal and internal DA differences are comparable); and (c) Positional distribution of DA differences for type 3 transitions. Note that in the case of closest paralogs (TSS = 1 and TSS = 2) the proportion of internal DA difference exceeds those of N-terminal or C-terminal changes.

