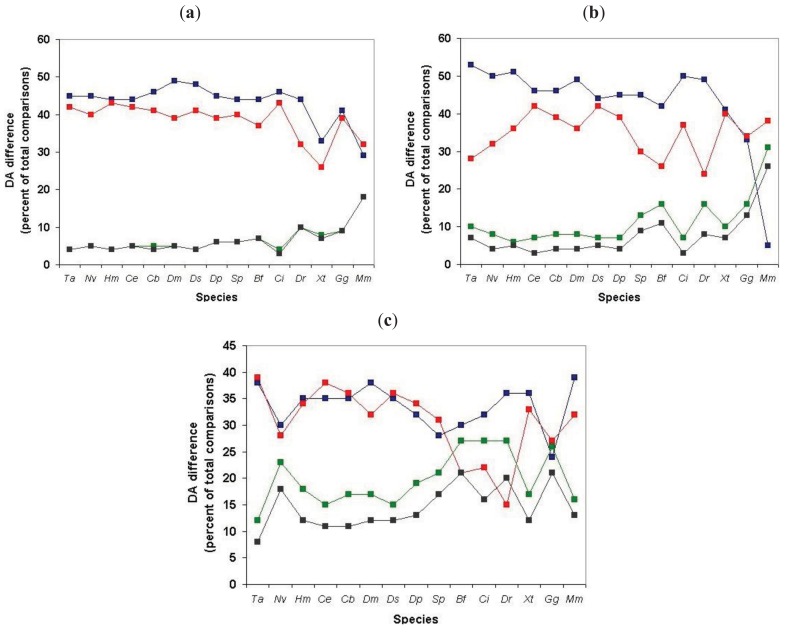
Figure 12.
Analysis of the positional distribution of DA differences in clusters of human Swiss-Prot proteins defined through comparison with RefSeq proteomes of various species. The ordinate shows the proportion of pair-wise comparisons within clusters where the pairs differ in DA. N-terminal differences (blue rectangles), C-terminal differences (red rectangles), internal differences (green rectangles), tandem duplications (black rectangles). (a) Positional distribution of DA differences for type 1 transitions; (b) Positional distribution of DA differences for type 2 transitions; and (c) Positional distribution of DA differences for type 3 transitions. Note that in the case of type 3 transitions the proportion of internal DA difference is comparable to those of N-terminal or C-terminal changes only in the case of chordate species. On the abscissa the species are listed in the order of decreasing evolutionary distance from Homo sapiens, thus the abscissa has a time-dimension but their distance is not drawn to scale. Abbreviations on the abscissa: Ta - Trichoplax adhaerens, Nv - Nematostella vectensis, Hm - Hydra magnipapillata, Ce -Caenorhabditis elegans, Cb -Caenorhabditis briggsae, Dm -Drosophila melanogaster, Dp -Drosophila pseudoobscura, Ds - Drosophila simulans, Sp - Strongylocentrotus purpuratus, Bf - Branchiostoma floridae, Ci - Ciona intestinalis, Dr - Danio rerio, Xt - Xenopus tropicalis, Gg - Gallus gallus, Mm - Mus musculus.

