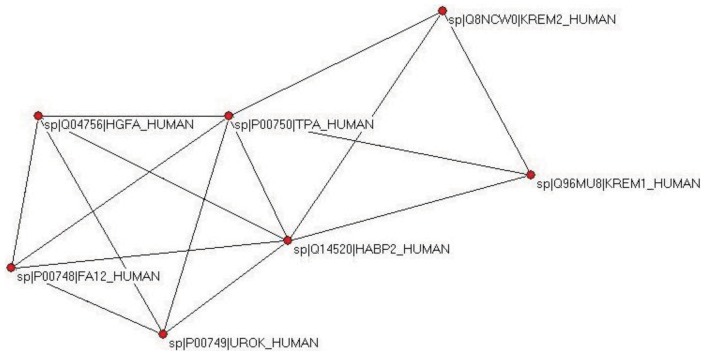
Figure 4.
Cluster containing TPA_HUMAN defined by analysis of the sequence similarity network for TSS = 3. Note that strong component analysis identifies a cluster that contains only paralogs (TPA_HUMAN, UROK_HUMAN, FA12_HUMAN, HGFA_HUMAN, HABP2_HUMAN), whereas the cluster defined by weak component analysis also contains two epaktologs: KREM1_HUMAN and KREM2_HUMAN).

