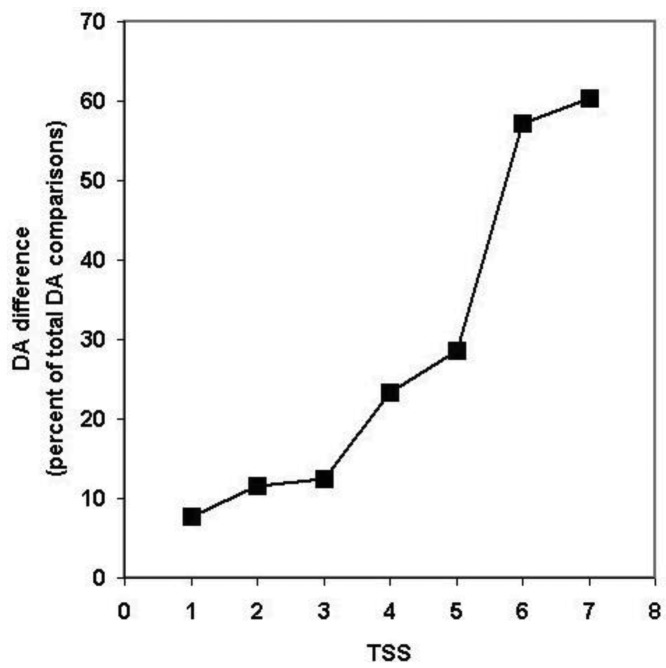
Figure 7.
Analysis of the DA of clusters defined by strong component analysis of sequence similarity networks of human Swiss-Prot sequences. The numbers on the abscissa indicate the number of top-scoring matches included in the analyses (TSS = 1, …. TSS = 7) used to define paralogous clusters. The values of the ordinate show the percent of DA comparisons within clusters where the pairs compared differ in DA. (Since the number of pair-wise comparisons and computational time increased exponentially with the increase of TSS values, the figure shows only data for TSS = 1−TSS = 7).

