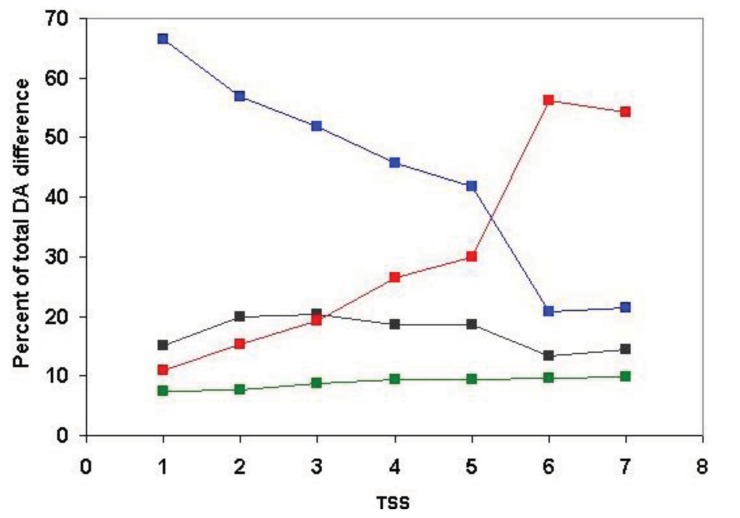
Figure 9.
Analysis of the relative frequency of homologous pairs of human Swiss-Prot sequences that differ in the number of domains by 1, 2, 3, … N domains in clusters defined by strong component analysis of sequence similarity networks of human Swiss-Prot sequences. Note that, in the case of close paralogs (TSS = 1, TSS = 2), the majority of pairs differ in a single domain (blue rectangle) and a small proportion of homologs differs in 2 (black rectangle), 3 (green rectangle) or ≥4 domains (red rectangle). Inclusion of more distant paralogs had little influence on the proportion of pairs that differ in 2 or 3 domains, however, a sharp increase in the proportion of DA changes involving ≥4 domains is observed when more than 5 top-scoring matches are included in the analysis. The numbers on the abscissa indicate the number of top-scoring matches included in the analyses used to define paralogous clusters.

