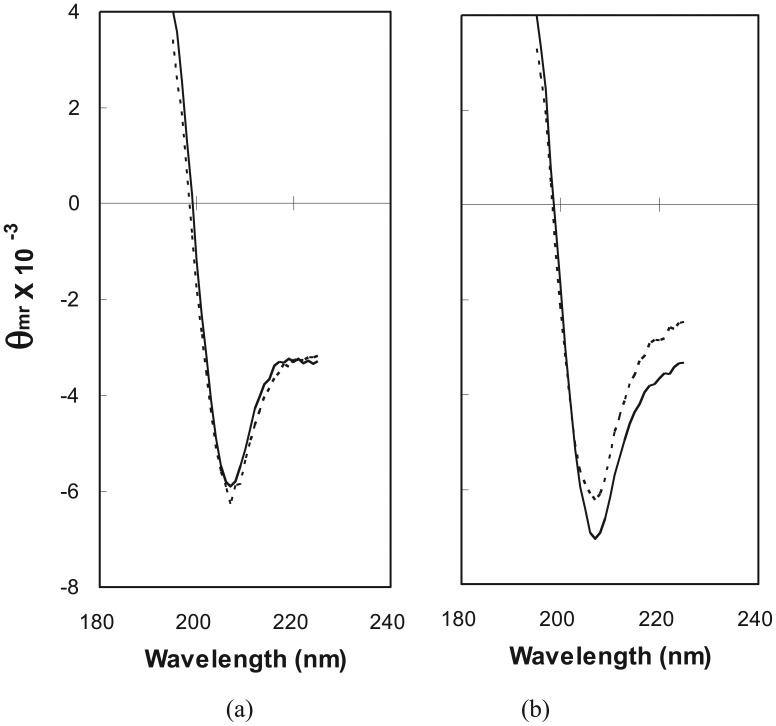
Figure 3.
Effect of temperature on CD spectra of ubiquitin and fusion pool. CD spectra of (a) ubiquitin and (b) LIB71 are shown at 25 °C (solid line) and 75 °C (broken line). Data were collected as described in the Experimental Section, except using 10 repeat scans from 195 to 225 nm, in 10 °C increments with 10 minute equilibration time.

