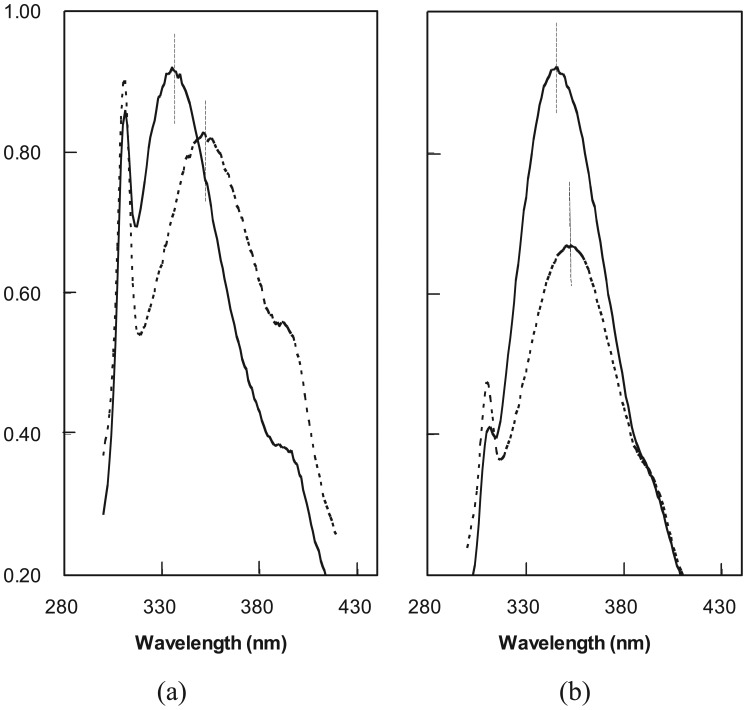
Figure 4.
Fluorescence emission (FE) spectra of fusion protein pools (a) LIB38; and (b) LIB71. The spectra were taken in water (solid lines) and in 6 M GuHCl (broken lines). Decreased intensity and red shift of the emission wavelength maximum in GuHCl indicate protein unfolding and tryptophan exposure. The fluorescence emission of ubiquitin in this range was low and unaffected by GuHCl.

