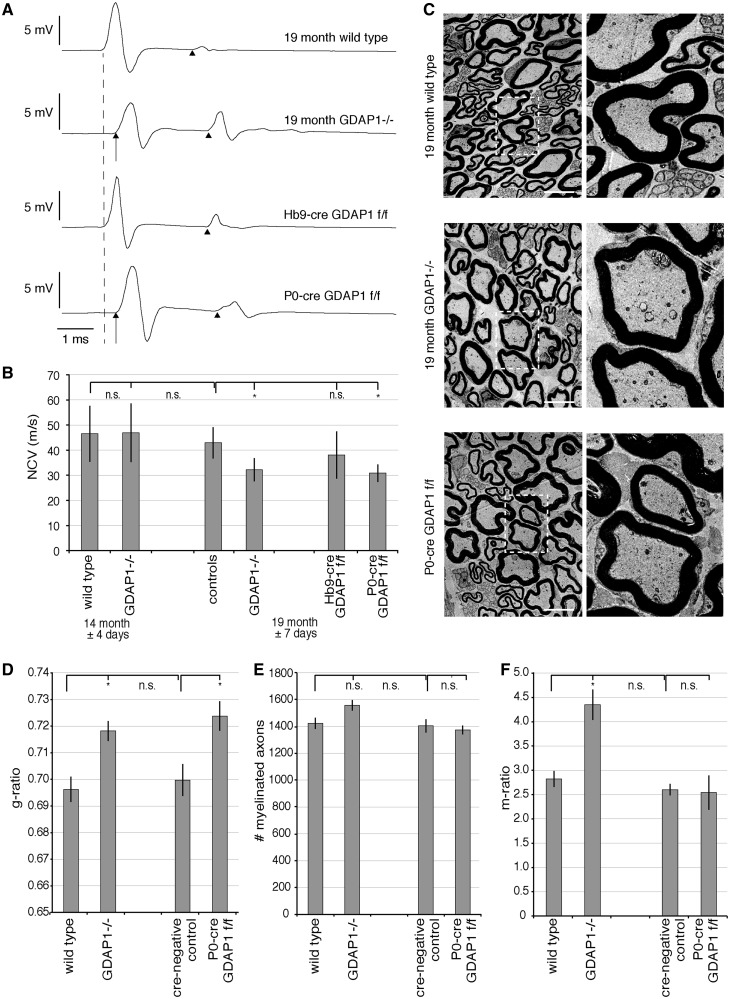
Figure 2.
Aged Gdap1−/− mice develop a hypomyelinating peripheral neuropathy. (A) Nerve conduction velocity (NCV) measurements of 19-month-old mice with different genotypes are shown as representative original recordings. The broken line represents onset (distal latency) of compound muscle action potentials in unaffected mice. Arrows denote a delayed compound muscle action potential onset (prolonged distal latency) in affected mice. Note that there is no relevant difference in shape and duration of compound muscle action potentials. F-waves are identified by arrowheads. (B) Nerve conduction velocities are represented as means and standard error, n = 6 to 11 animals per genotype and age group; variations of age are indicated as standard error; controls are a group of wild-type and cre-negative animals. n.s. = not significant, *P < 0.05. (C) Transverse ultrathin sections of plantar nerves of 19-month-old Gdap1−/− and P0-cre Gdap1flox/flox (f/f) animals reveal hypomyelination compared to age-matched controls. Scale bars = 5 µm, squares are shown at higher magnification. (D) Quantitative morphological analysis of ultrathin plantar nerve sections at 19 months showing hypomyelination in Gdap1−/− and P0-cre Gdap1flox/flox animals compared with wild-type and cre-negative controls. (E) Quantitative analysis of the total number of myelinated axons in the plantar nerve. (F) The m-ratio, defined as the percentage of the area covered by intra-axonal mitochondria divided by the total area of the axon, is significantly increased only in Gdap1−/− animals. (D and F) One hundred randomly selected myelinated axons were measured per animal. (D–F) represent the means and standard error of independent experiments; cre-negative controls and P0-cre Gdap1flox/flox: n = 3 animals each; wild-type and Gdap1−/− n = 4 animals each; n.s. = not significant, *P < 0.05.

