Figure 3.
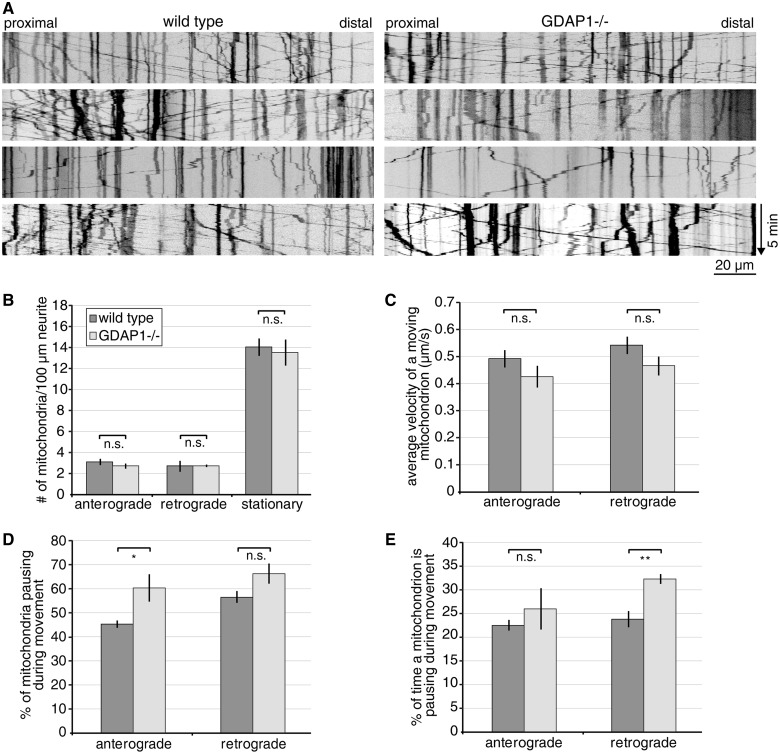
Gdap1−/− dorsal root ganglia explant cultures reveal mild mitochondrial transport impairment. Five to nine dorsal root ganglion neurons expressing mitochondrially targeted DsRed were imaged per genotype and experiment, resulting in the analysis of 200 to 400 mitochondria per genotype and preparation. The movies were converted into kymographs (A) and quantified (B–E). (A) Representative kymographs of wild-type and Gdap1−/− neurons reveal no obvious impairment of mitochondrial transport. Vertical lines represent stationary mitochondria, lines crossing from left to right or right to left represent antero- or retrograde transport, respectively. (B) Quantification of the number of stationary and moving mitochondria (subdivided in anterograde or retrograde direction) per 100 µm of neurite length reveals no difference between Gdap1−/− and wild-type cultures. (C) The velocity of moving mitochondria is not altered in anterograde and retrograde direction in Gdap1−/− neurons. (D) During the acquisition period of 5 min, significantly more mitochondria moving in anterograde direction pause, (E) and the time a retrograde-moving mitochondrion spends pausing is significantly longer in Gdap1−/− cultures compared to wild-type controls. (B–E) Graphs represent means and standard error of n = 4 independent culture preparations per genotype, n.s. = not significant, *P < 0.05, **P < 0.01.

