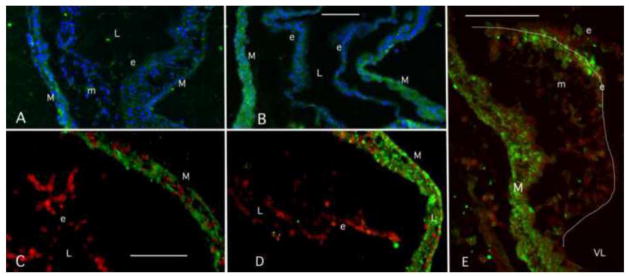
Figure 2.

CYP2C Localization in Embryonic hearts. Representative staining is shown in two control and treatment pairs (A, B & C, D) from separate experiments. Each pair was treated together and examined with the same microscope settings. CYP2C antibody expression is observed primarily myocardium of the developing chick heart in control and 8 ppb TCE-treated samples. Some endothelial staining was seen in one control (A) while little was seen in the other (C). The extracellular matrix lies between the two cell layers. TCE-exposed embryos showed an increase in myocardial staining that corresponds with the PCR data. Increases in endothelial staining were variable and reflect region differences. Small amounts of staining are seen in mesenchymal cells. A sagittal section of a cardiac cushion shows strong staining on the atrial (inflow) side of the cushion where flow becomes constricted (E). Green= CYP2C, Blue is DAPI nuclear stain, Red is Topo3 nuclear stain. Outline of the cardiac cushion is indicated by the white line in E. M=myocardium, e = endothelium, m= mesenchyme (formed from endothelium), L= lumen, VL= ventricular lumen. Scale marker indicates 75 micrometers and the scale is the same in each matched pair.
