Figure 11.

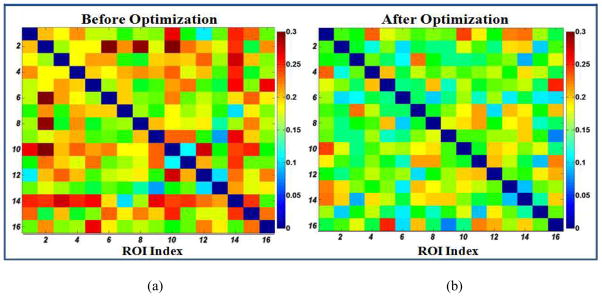
Quantitative comparison of the standard deviation of functional connectivity within the working memory network before (a) and after (b) the optimization. Lower values mean more consistent connectivity pattern cross subjects.

Quantitative comparison of the standard deviation of functional connectivity within the working memory network before (a) and after (b) the optimization. Lower values mean more consistent connectivity pattern cross subjects.