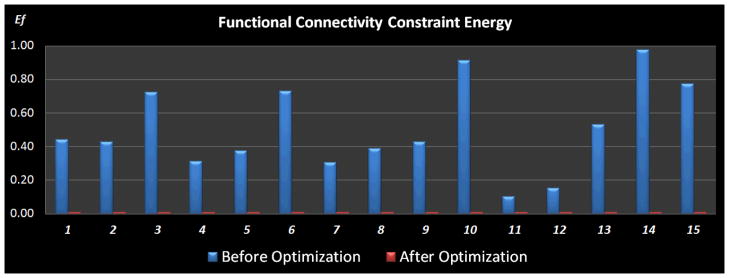
Figure 12.

Comparison of the normalized functional connectivity constraint energy between before (blue) and after (red) optimization. The optimization procedure was repeated 15 times, each of which was initialized with random ROI locations. Optimization parameters for simulated annealing algorithm: K = 1, Tstart = 8, and Tend = 0.05.
