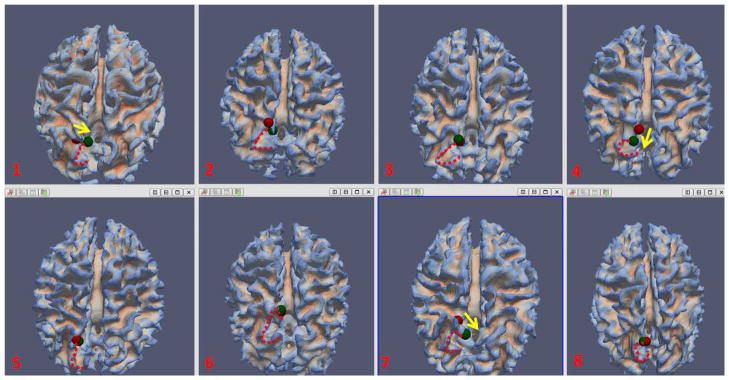
Figure 15.

The movement of right precuneus before (in red sphere) and after (in green sphere) optimization for eight subjects. The “C”-shaped red dash curve for each subject depicts a similar anatomical landmark across these subjects. The yellow arrows in subject 1, 4, and 7 visualized the movement direction after optimization.
