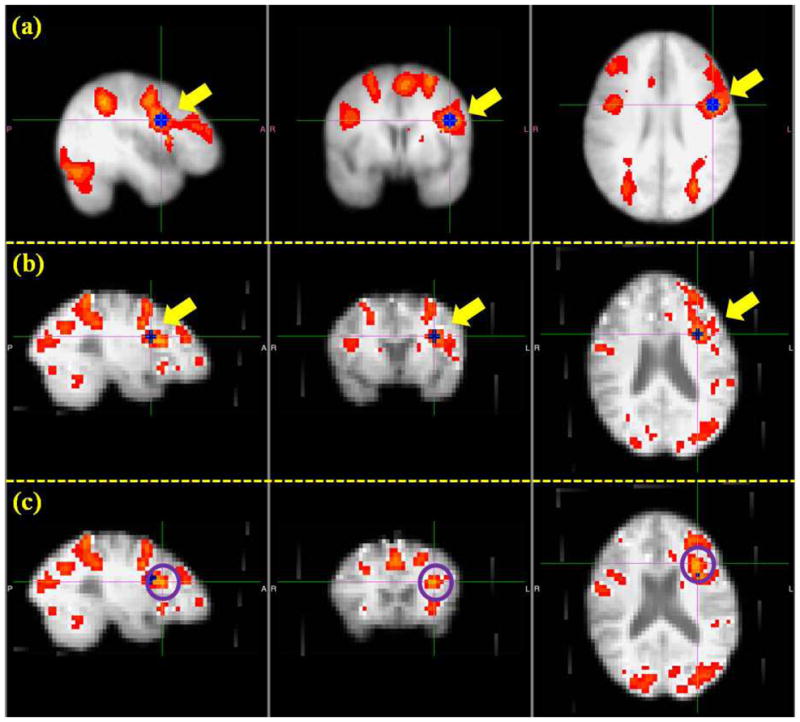
Figure 16.

An illustration of the identification of benchmark ROIs. (a): Group activation map and one example of group ROI (the blue one highlighted by yellow arrows). (b): Individual activation map and the registered ROI in the subject space (the blue one highlighted by yellow arrows) from the group template. (c): Identified benchmark ROI (the voxel highlighted by the cross and the center of highlighted circles).
