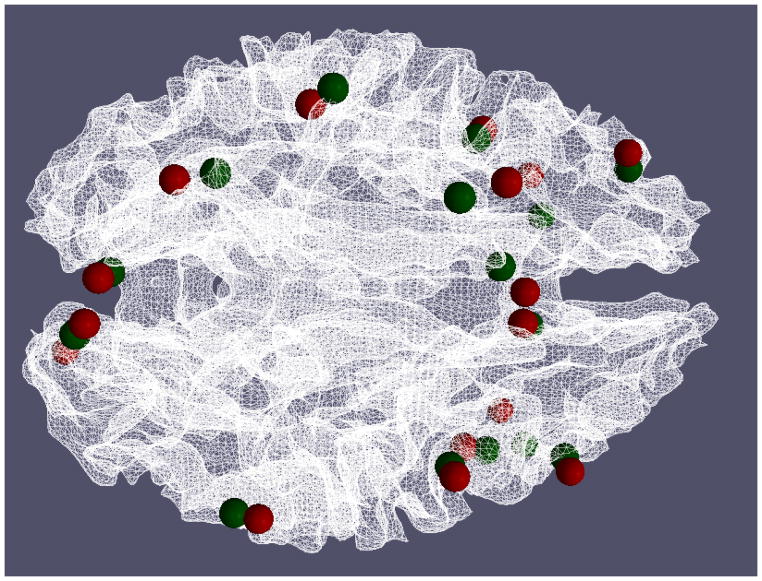
Figure 17.
Visualization of optimized ROIs (green spheres) and benchmark ROIs (green spheres). The average distance between optimized ROIs and the benchmarks is 8.30±0.46mm. The average distances for each ROI across 15 runs are 8.31mm, 8.75mm, 7.83mm, 8.18mm, 8.50mm, 8.67mm, 7.77mm, 7.55mm, 8.08mm, 9.40mm, 8.45mm, 8.42mm, 8.00mm, 8.70mm, 8.39mm, and 7.89mm respectively.

