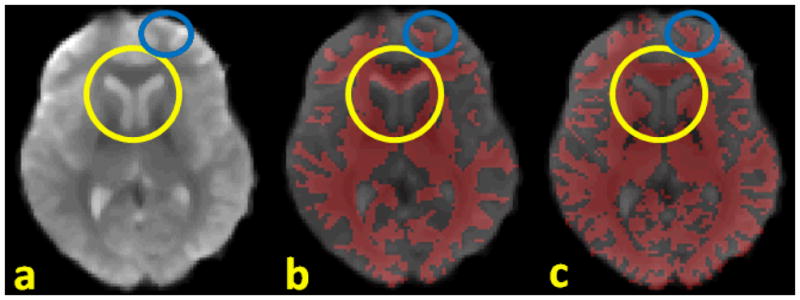
Figure 3.

Comparison of misalignments between different modalities. (a): fMRI data; (b): fMRI overlapped by WM segmentation from T1 data; (c): fMRI overlapped by WM segmentation from DTI data; the yellow circles and blue circles highlight the severe misalignment of T1 segmentation to fMRI versus that of DTI segmentation.
