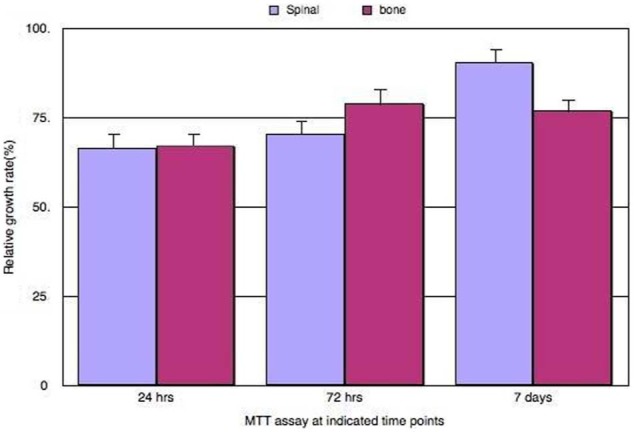
Figure 2.

Biocompatibility MTT toxicity assay using MG-63 cell line; the graph shows the percentage of proliferating cells based on mitochondrial enzyme activity of the cultured MG-63 live cells seeded on both cements, Cerament Bone Void Filler and Cerament Spinal Support, at different time points. On the x-axis is the different treatments done at 24 h, 72 h and at 1 week; the y-axis shows the percentage of proliferating cells calculated in different treatments. Purple and pink bars represent the Cerament Bone Void Filler cement and Cerament Spine Support cement, respectively. The figure indicates that at 1 week of cell culture, there was no statistically significant difference between the percentage of active proliferating live cells between Cerament Bone Void Filler and Cerament Spinal support (p > 0.05), after analysis using student t-test on SPSS software (error bar = SD, n = 3).
MTT: methyl thiazolyl tetrazolium; SD: standard deviation.
