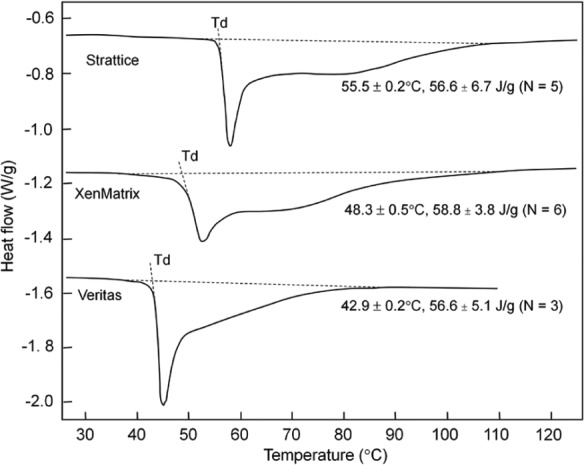
Figure 4.

Thermograms of bioscaffold denaturation. Calorimetric thermograms of three bioscaffolds at the scan rate of 3°C/min. Note that significant modifications of extracellular matrices are observed in finished bioscaffold products when compared to unprocessed fresh tissues (see Figure 3).
