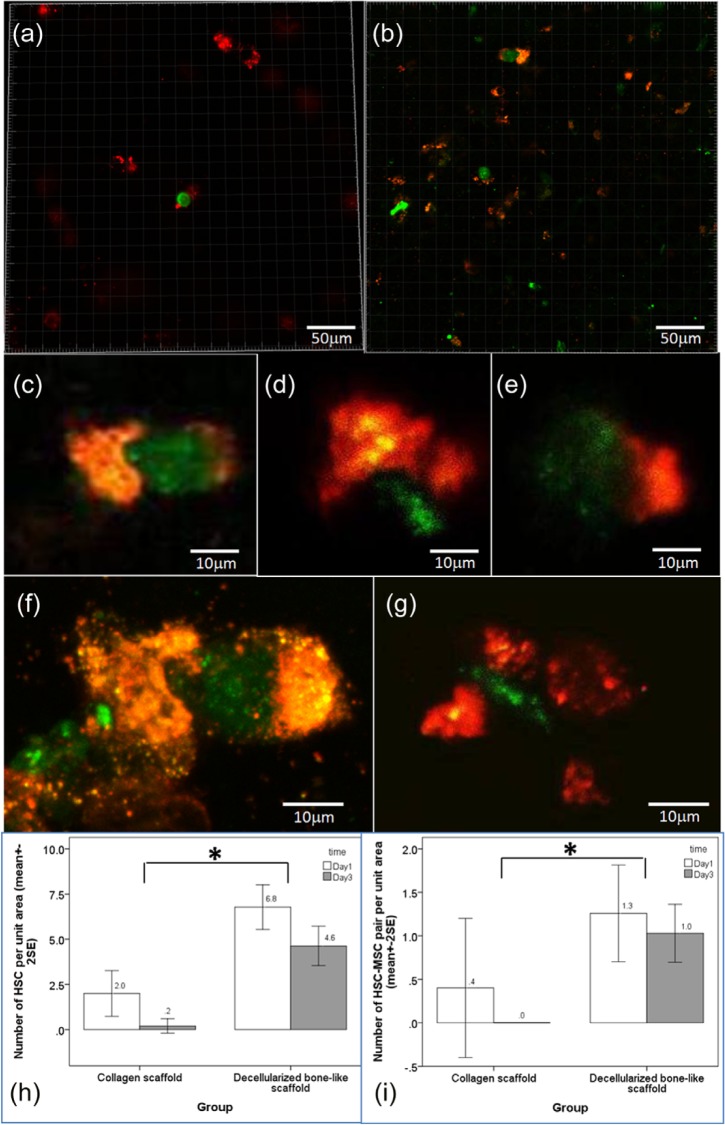
Figure 4.
MSC–HSC interactions on pure collagen scaffold and bone-like matrices derived from osteogenically differentiating MSCs. Dual-channel confocal microscopic images were captured at different magnifications for image analysis. (a) hMSCs and hHSCs co-cultured on pure collagen scaffolds and (b) hMSCs and hHSCs co-cultured on decellularized osteogenic differentiated mMSC–collagen constructs (red: hMSC; green: hHSC). Representative images showing hMSC–hHSC pairs on (c–e) day 1 (scale bar: 50 µm) and (f–g) day 3 (scale bar: 10 µm). Bar chart showing the mean number of (h) hHSCs and (i) hHSC–hMSC pairs per unit area in pure collagen scaffold and decellularized bone-like constructs (n = 2, each with 3–8 views, *statistical significant difference, p < 0.001 for (h) and p = 0.026 for (i)).
MSC: mesenchymal stem/stromal cell; HSC: hematopoietic stem cell; hMSCs: human mesenchymal stem/stromal cells; hHSC: human hematopoietic stem cells.

