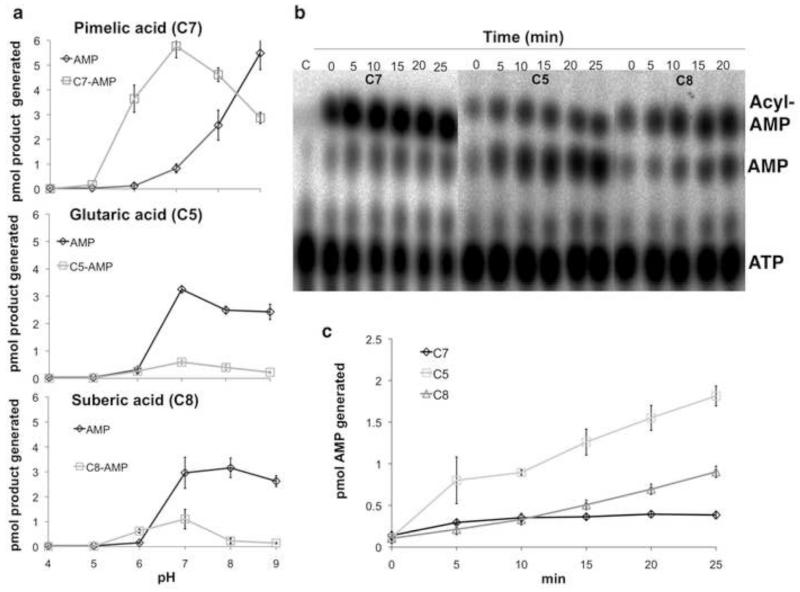
Figure 3. Cleavage of cognate and noncognate adenylates.
(a) The pH profiles of BioW activity with pimelate (top), glutarate (middle) and suberate (bottom) in absence of CoA. Buffers of sodium acetate (pH 4 and pH 5), sodium 2-(N-morpholino)ethanesulfonic acid (pH 6), sodium HEPES (pH 7) and Tris-HCl (pH 8 and pH 9) were used to determine the pH profile of the BioW reaction for 1 h at 37°C. (b) BioW catalyzed glutaryl- and suberyl-adenylate hydrolysis was assayed by determining the rate of AMP production with time. Reactions with pimelate (C7) were included for comparison. At different time points 1 μl samples of BioW reactions performed at pH 7.0 and 37°C were spotted onto cellulose TLC plates followed by development and autoradiography. (c) Quantitation of the data points of panel b were used to show the rate of formation of AMP with increasing time with C7, C5 and C8 as substrates. The intensities of the spots were quantitated using the phosphor-imaging software of the Fujifilm FLA-3000 phosphoimager. The percent of photostimulated luminescence of AMP and acyl-AMP spots obtained from the reaction was compared to that of the ATP spot obtained from a control reaction lacking enzyme included on each cellulose TLC plate to derive the amounts of products generated. All reactions were repeated three times and the bars denote standard deviations.

