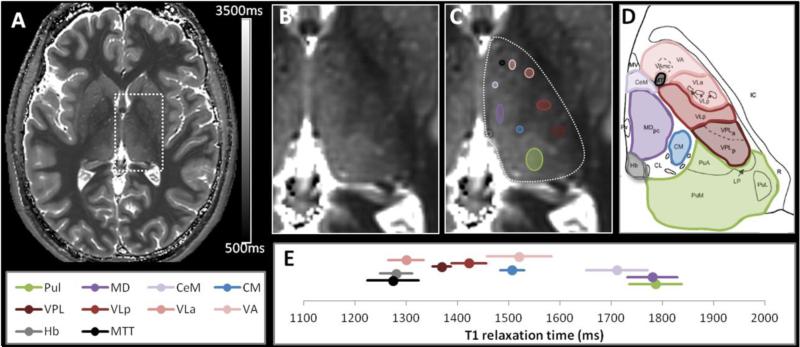
Figure 1. T1 map and locations of the intra-thalamic regions of interest (ROI).
A representative T1 map is shown (A) with an enlarged view of the left thalamus without (B) and with regions-of-interest (ROI) (C). The corresponding plate of the Morel atlas (Morel et al., 1997) is shown for anatomic correspondence (D) (abbreviations as described in Methods). The mean T1 values and their corresponding across-subject standard deviations for the 5 volunteers are plotted in (E, see also supplemental table). The colors of the ROI and of the segments on the plot match the colors used on the atlas plate.

