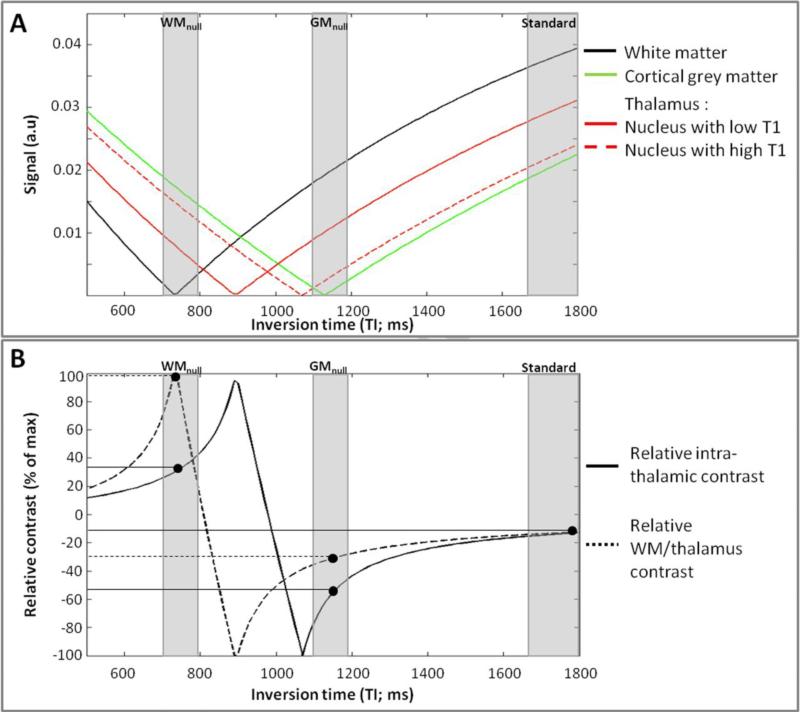
Figure 2. Global regime of contrast - Simulations.
The signal intensity was simulated as a function of TI (A) with the other MR parameters as described for in vivo experiments in Figure 3 and with the T1/PD values as described in Results (T1 measurements) and Table 1. The corresponding intra-thalamic relative contrast and the relative contrast between the external thalamus (exhibiting the lower T1 values) and the surrounding WM are shown in (B). The contrast between structures A and B was defined as (A-B)/(A+B) rather than (A-B)/A to avoid divide-by-zero effects.
From these simulations, the standard MPRAGE (close to the CSF null regime) provides good signal but poor contrast within the thalamus and between the thalamus and the surrounding WM. The WM null regime yields about 38% increase of the maximum intra-thalamic signal compared to the GM null regime and the best contrast between the external thalamus and the surrounding WM while staying close to one of the peaks for intra-thalamic contrast.

