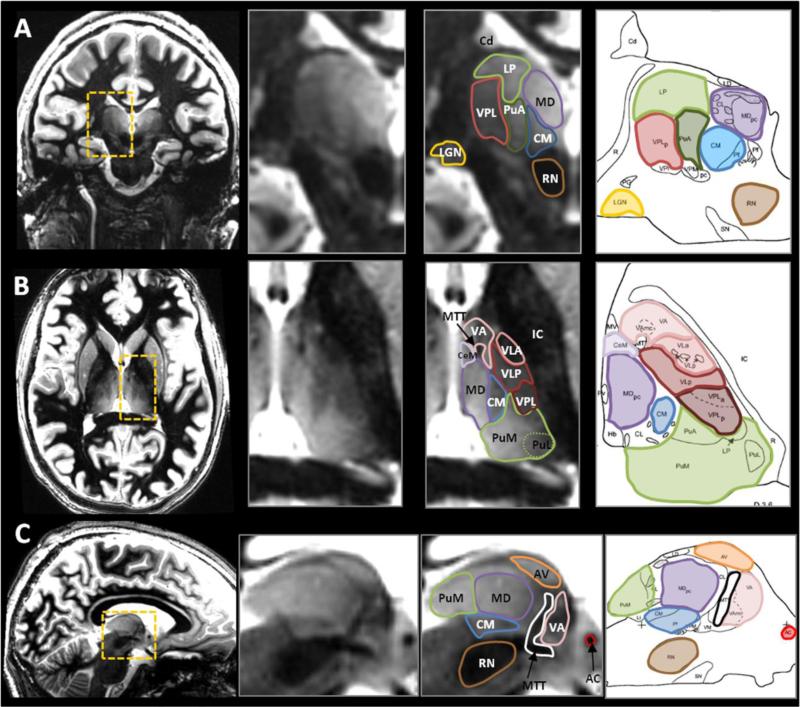
Figure 7. Visualization of thalamic nuclei compared with histological plates.
Representative examples of MR scans in the 3 orthogonal orientations (each orientation shown in a different volunteer) and presented with the corresponding histological plates (Morel et al., 1997). Several nuclei can be identified thanks to enhanced intrinsic contrast between adjacent structures. Also, thin hypointense bands helped to isolate structures with otherwise close signal. For example, see the thin boundaries around the pulvinar anterior (PuA, green) in coronal (A), around the ventral anterior nucleus (VA, pink) in axial (B), and around the anterior ventral nucleus (AV, orange) in sagittal (C). Good correspondence between MR boundaries and the atlas can be observed.

