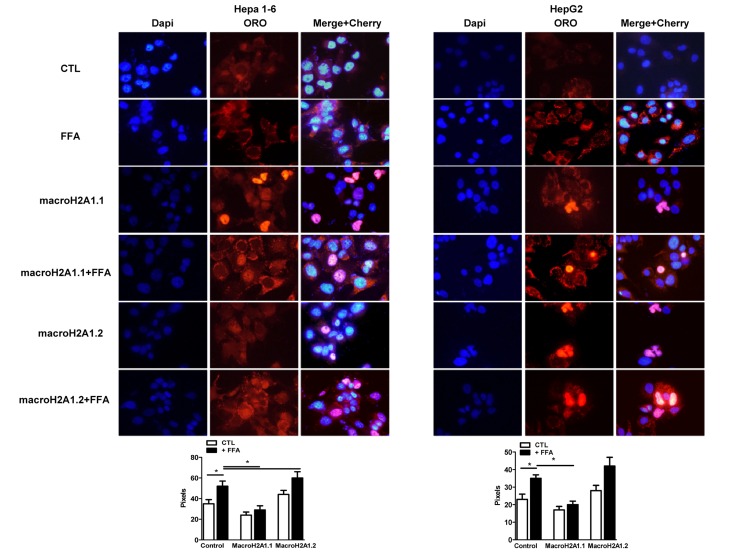
Figure 2.
Overexpression of macroH2A1 isoforms (macroH2A1.1 or macroH2A1.2) and lipid accumulation in Hepa1-6 cells and HepG2 cells. Upper panels: cells were transiently transfected with Lipofectamine with either an empty vector (control, CTL) or with Cherry-tagged macroH2A1.1 and macroH2A1.1 constructs. 24 hours post transfection cells were exposed to a 100 mM 1:1 mixture of oleic acid/linoleic acid (FFA) conjugated with albumin, for an additional 24 hours. Cells were then fixed, nuclei stained with DAPI (blue) and lipids with ORO. Overlay of Cherry tagged macroH2A1-transfected nuclei and DAPI staining is observed in pink. Lower panel: quantifications of ORO stained areas are means ± SEM of 1000 cells per condition. *p<0.05.

