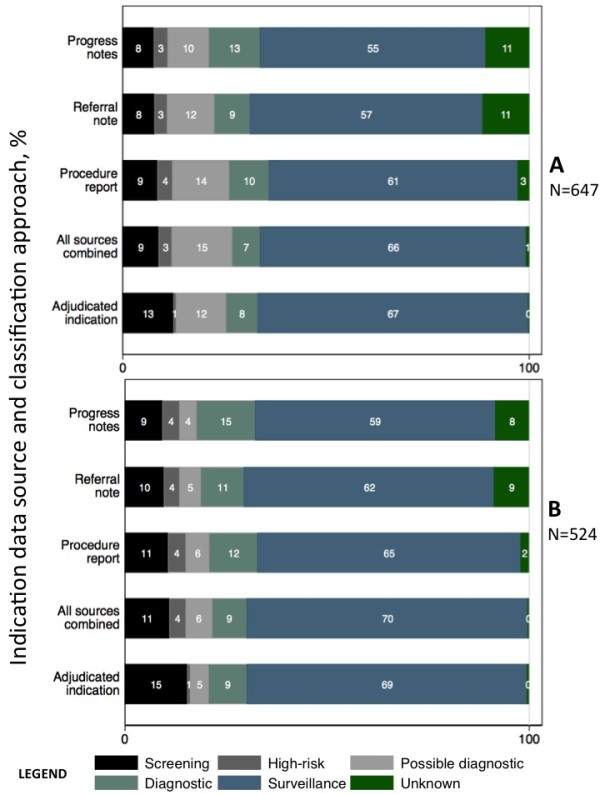
Figure 3.

Percentage distribution of colonoscopy indication by medical records data sources and targeted adjudication, at the test-level and analytic or patient-level. *The numbers are the percentages in each classification group for colonoscopies in Figure 3A or patients in Figure 3B. There were 647 colonoscopies observed in 524 patients. The distribution of indication in Figure 3B, correspond to the analytic variable. Each of the colored sections of the stacked bars represents the classification of the indication as shown in the legend. The “all sources combined” indication is assigned with data from all sources using the classification algorithm.
