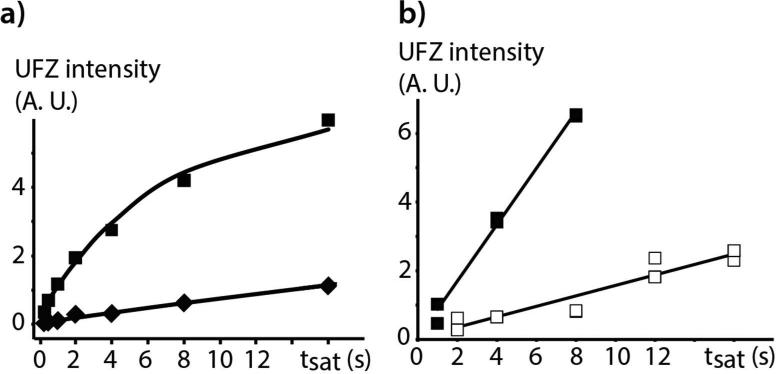
Figure 4.
Evolution of the UFZ intensity as a function of the saturation duration for a) the mixture of cryptophane 1 and cryptophane 2, at 30 μM and 90 μM in H2O respectively. The diamonds show the data points for 1, and the squares the data points for 2; b) cryptophane 2 alone at 0.5 μM in H2O. In a) the saturation field value was 2.4 μT, in b) the saturation field was either 2.4 μT (white squares) or 4.8 μT (black squares). In each series and for each saturation duration value, two acquisitions have been performed (and the summed areas of the FID and the first echo for each data point were used).

