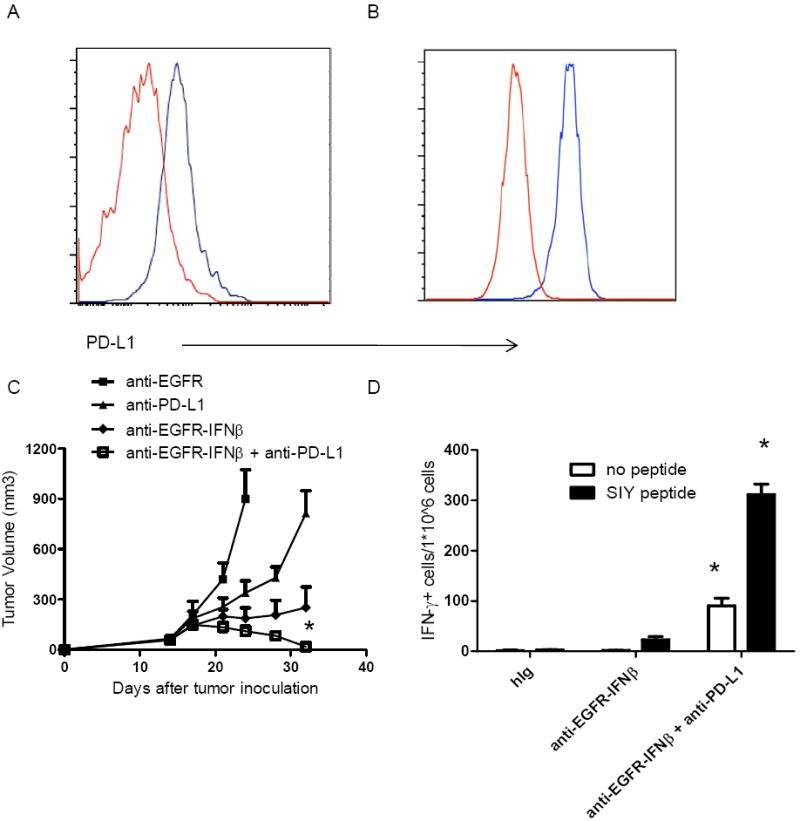
Figure 7. Antagonizing PD-L1 expression induced by anti-EGFR-IFNβ achieves tumor-free outcome.

A) WT B6 mice were injected subcutaneously with 5×10⁵ B16-EGFR-SIY cells and treated with 25 μg of anti-EGFR-IFNβ or control Ab on days 14. Two days later, tumor cells were collected and PD-L1 expression was analyzed by flow cytometry. Red line indicates control Ig treated and blue line indicates anti-EGFR-IFNβ treated group. B) B16-EGFR-SIY cells and treated with 0.02μg/ml of anti-EGFR-IFNβ during in vitro cell culture. One day later, tumor cells were collected and PD-L1 expression was analyzed by flow cytometry. Red line indicates control Ig stimulated and blue line indicates anti-EGFR-IFNβ stimulated cells. C) WT B6 mice (n=5/group) were injected subcutaneously with 5×10⁵ B16-EGFR-SIY cells and treated with 25 μg of anti-EGFR-IFNβ or control Ab on days 14, 18, and 22. A PD-L1-blocking antibody (400μg/mouse) was administered on the same day as anti-EGFR-IFNβ. The tumor growth was measured and compared twice a week. D) Fourteen days after last treatment, splenocytes were collected and IFNγ ELISPOT assay was performed. *, p < 0.05 compared with control group. Mean + SEM are shown. One representative experiment of three is depicted. See also Figure S6.
