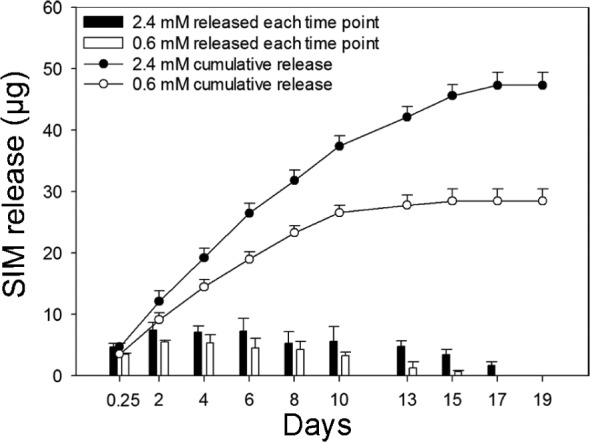
Figure 3.

Simvastatin (SIM) release. Release profile of SIM from alginate-coated TiO2 scaffolds containing 2.4 mM and 0.6 mM SIM after 19-day incubation at 37°C. Bar graph shows the amount of SIM released after each time point. Line graph represents cumulative amount of SIM released up to 19 days. Values represent the mean ± SD.
SD: standard deviation.
