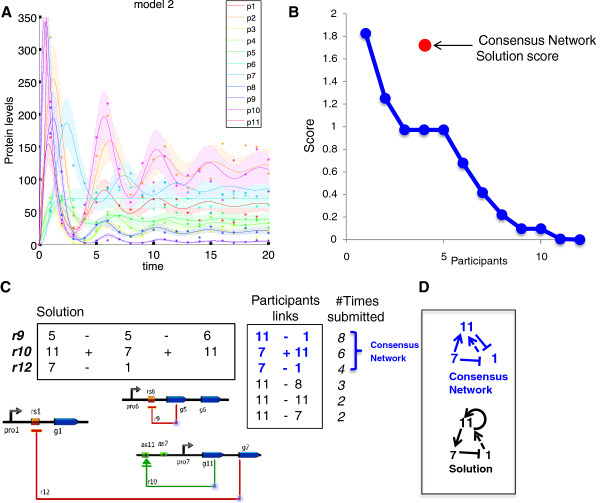
Figure 4.
Dynamics and scores of the network topology challenge. A. Time courses of the proteins from the 11 proteins in the model 2 network. Dots are the data with noise, lines represent the data without noise and shades the associated noise model. B. Ordered scores from the participants as well as the score of the consensus solution defined as the 3 most submitted links. Scores were calculated from the p-values as indicated in Methods, Additional file 2: Figure S2 and Additional file 1. C. The 3 links r9, r10, r12 composing the solution to the Network Inference challenge are shown in their numeric (top left) and diagram (bottom left) notations. The list of submitted participant links is shown (right) in its numeric notation as well as the number of times such links were submitted. The links colored in blue indicate the consensus network composed of the 3 most submitted links whose score is indicated in (B). D. Diagrams of consensus network of links (blue) and solution (black). Dashed arrow indicates an indirect regulation.

