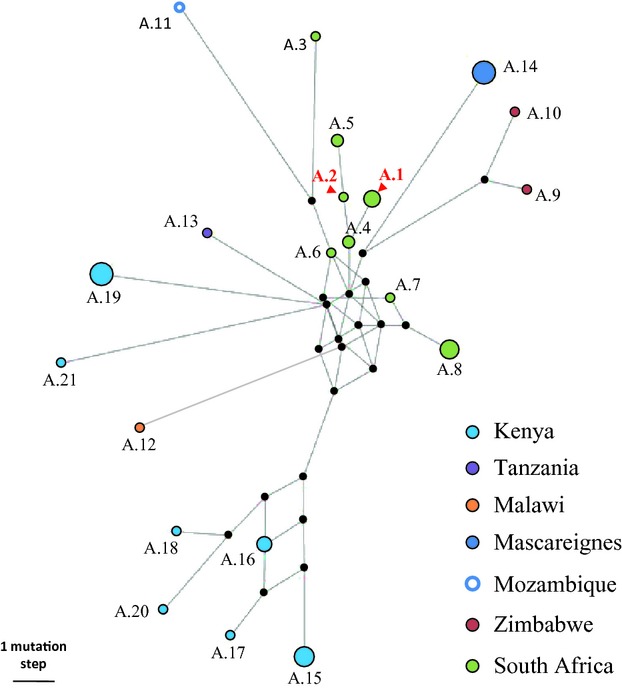
Figure 2.

Reduced median network (Bandelt et al. 1999) of the 21 chlorotypes detected in the African range of subsp. cuspidata (lineage A; Besnard et al. 2007b). Each chlorotype is represented by a dot, whose width is proportional to the number of occurrences in our sample. See Table S3 for chlorotype profiles and geographic origins. The length of branches is proportional to the number of mutational steps. The missing, intermediate nodes are indicated by small black points. For each chlorotype, the country of origin is indicated by a specific colour. The two African chlorotypes detected in NSW are indicated in red (A.1 and A.2; both were detected in the population of Cape Town, South Africa).
