Figure 3.
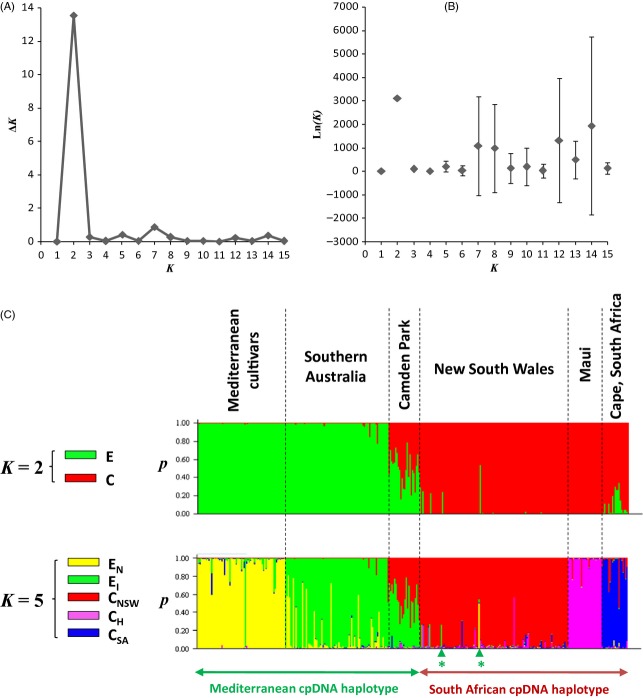
Inference of population structure in native and invasive olive accessions based on 11 nuclear SSRs and using Bayesian simulations with Structure (Pritchard et al. 2000). (A) Absolute values of the second-order rate of change of the likelihood distribution divided by the s.d. of the likelihoods (ΔK) for each K value; (B) Mean log likelihood [Ln(K) ± SD] averaged over the ten iterations for each K value; (C) Barplot of the Structure analysis based on the best two K values (i.e. 2 and 5) according to Ln(K) and ΔK criteria (Evanno et al. 2005). The percentage of assignment of each individual to the clusters averaged over ten iterations is shown. Each vertical bar represents an individual. The chloroplast lineages match with the two clusters defined on nuclear SSRs except for admixed individuals (*indicate Mt Annan no 17 and Bringelly no 21). At K = 2, clusters E and C reflect the strong genetic differentiation between subspecies europaea and cuspidata, respectively. At K = 5, native and invasive Mediterranean olives are mostly assigned to clusters EN and EI, respectively. Similarly, African olive individuals from South Africa, NSW and Hawaii are mostly assigned to three distinct clusters, namely CSA, CNSW and CH.

