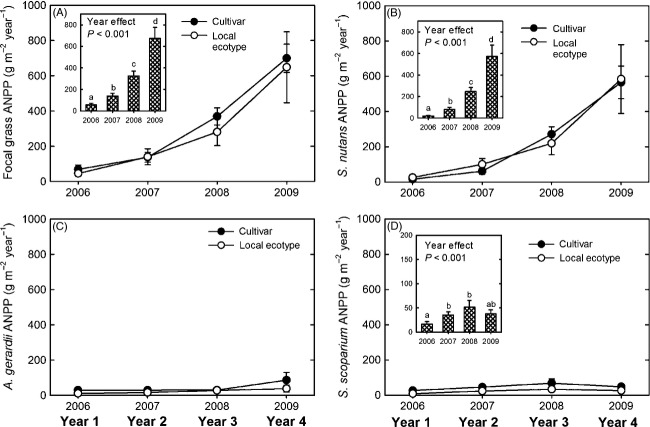
Figure 2.
Average (± standard error) aboveground net primary productivity (ANPP) of cultivar and local ecotype sources of (A) all focal grasses, (B) Sorghastrum nutans, (C) Andropogon gerardii, and (D) Schizachyrium scoparium in each restoration year. Inset graphs present significant main effects of time if there was no interaction between dominant grass source and species pool. Means accompanied by the same letter were not significantly different (α = 0.025).

