Figure 1.

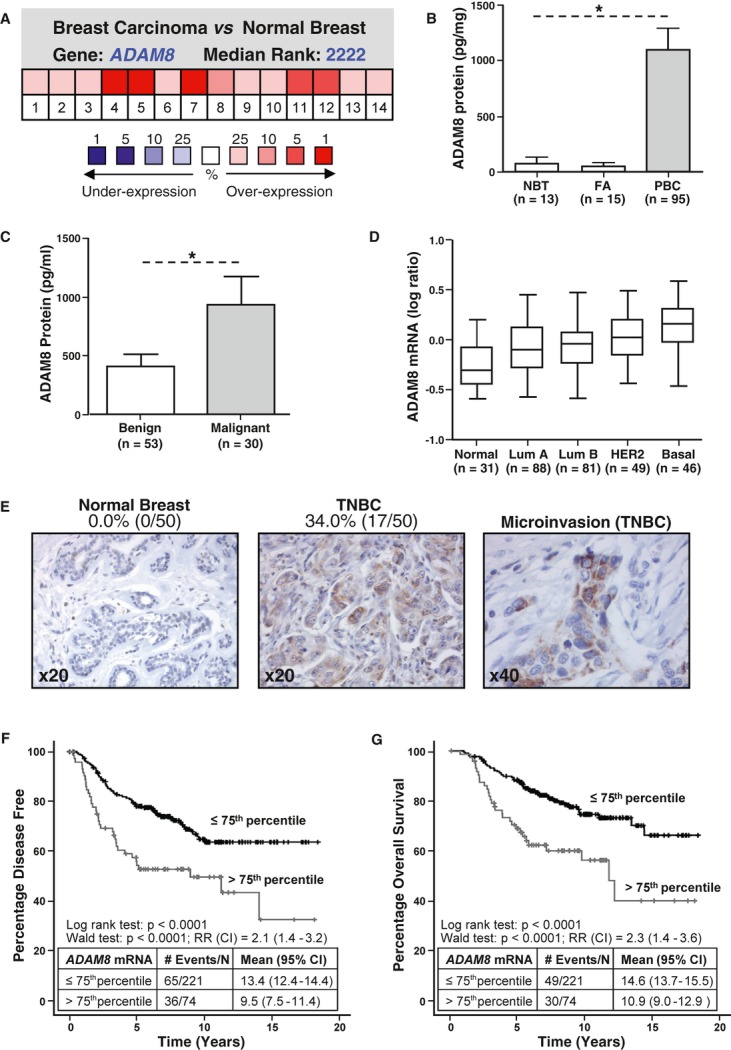
A ADAM8 mRNA expression in samples from breast tumor and normal breast tissue was analyzed using the Oncomine microarray database. Pooling of 14 analyses from six different microarray studies shows ADAM8 is one of the more highly expressed genes in breast cancer versus normal tissue. P = 0.025, Student's t-test.
B, C ADAM8 protein levels were measured by ELISA in samples from adjacent normal breast tissue (NBT), fibroadenoma (FA) and primary breast carcinoma (PBC) (B), and in serum of patients with either benign or malignant breast disease (C). * P < 0.0001, Kruskal–Wallis test (B); * P = 0.034, Mann–Whitney U-test (C).
D ADAM8 mRNA expression was analyzed across the different molecular breast cancer subtypes in the van de Vijver microarray dataset, which includes 295 primary breast tumors from normal-like (Normal), luminal A (Lum A), luminal B (Lum B), HER2, and basal-like (Basal) subtypes (van de Vijver et al, 2002). * P < 0.0001 for Basal versus other groups, Kruskal–Wallis test.
E Representative pictures of ADAM8 staining analyzed by immunohistochemistry in adjacent normal epithelial tissue and primary TNBC samples from 50 patients or areas of microinvasion. Percentages of ADAM8-positive samples are given.
F, G Kaplan–Meier curves show the percentage of disease-free survival (F) and overall survival (G) for 295 patients with primary breast cancer stratified based on ADAM8 mRNA levels using the 75th percentile. P < 0.0001, Log-rank test (RR, relative risk, CI, confidence interval).
