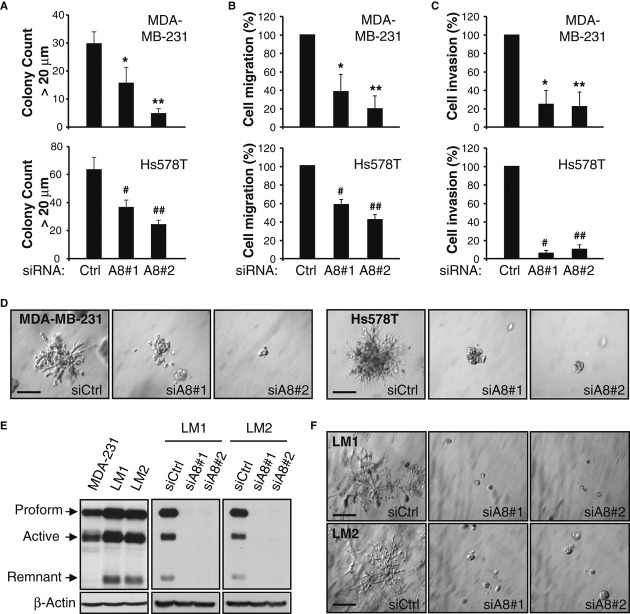
Figure 3.
A–D Cells were transfected with siRNAs as in Fig 2D and E for 24 h, and tested for colony formation in soft agar (A), cell migration (B), invasion (C), and 3D-Matrigel outgrowth (D). For soft agar assays, cells were grown for 8-12 days and colonies >20 μm diameter in 3 wells/condition were counted with ImageJ software. A representative of two experiments with similar results is shown. * P = 0.002, ** P = 1.9E-6, # P = 1.3E-5, ## P = 1.0E-7, Student's t-test (A). Migration (B) and invasion (C) assays were performed for 24 h using Transwells without or with precoating of Matrigel, respectively. Control condition (siCtrl) is set to 100% (mean ± s.d. from three independent experiments). * P = 0.004, ** P = 5.3E-4, # P = 1.8E-4, ## P = 5.5E-5, Student's t-test (B). * P = 0.001, ** P = 9.3E-4, # P = 8.7E-6, ## P = 4.6E-5, Student's t-test (C). For Matrigel outgrowth assays, colonies formed after 5-7 days were photographed at 20× magnification. Experiments were done twice with similar results. Bars: 100 μm (D).
E WCEs from MDA-MB-231 cells and in vivo derived LM1 and LM2 lines, either untransfected (left panel) or transfected with siCtrl or siA8 for 48 h (right panels), were subjected to WB for ADAM8 (LSBio antibody). A representative blot is shown ( n = 3).
F Twenty-four h after siRNA transfection, LM1 and LM2 cells were subjected to a 3D-Matrigel outgrowth assay, as in (D), except that colonies were photographed after 4 days. Experiments were done twice with similar results. Bars: 100 μm.

