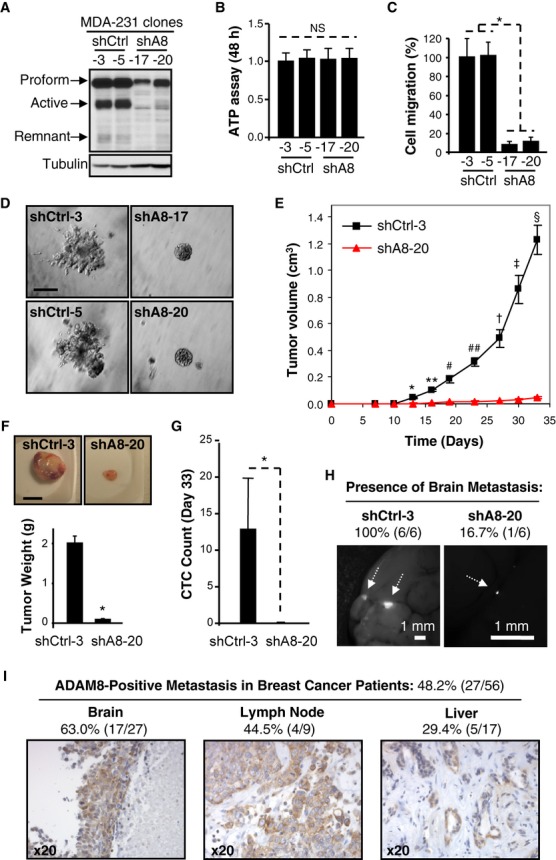
Figure 4.

A–D Stable ADAM8 KD (shA8) clones were characterized in vitro. ADAM8 expression in WCEs from two shA8 clones (shA8-17 and shA8-20) were compared with two shCtrl clones (shCtrl-3 and shCtrl-5) using WB (LSBio antibody) (A). Clones were grown in 2D-cultures for 48 h and subjected to an ATP assay. NS: non significant, Student's t-test, n = 3 (B). Migration assays were performed as described in Fig 3B. * P = 6.8E-14, Student's t-test, n = 3 (C). Matrigel outgrowth assays were performed as in Fig 3D. Experiments were done twice with similar results. Bar: 100 μm (D).
E–H MDA-MB-231 derived shCtrl-3 and shA8-20 cells were injected into the MFP of female mice ( n = 7/group). Tumor volume was measured twice a week (mean ± s.e.m.). * P = 1.4E-6, ** P = 9.8E-8, # P = 3.0E-5, ## P = 9.7E-7, † P = 1.7E-5, ‡ P = 5.1E-6, § P = 2.0E-7, Student's t-test (E). At the end of the experiment, tumors were photographed and weighed (mean ± s.e.m.). * P = 5.6E-8, Student's t-test. Bar: 1 cm (F). Blood was collected by cardiac puncture and GFP-positive CTCs were detected by flow cytometry. Average CTC count ± s.d. is given per μl of blood. * P = 0.006, Student's t-test (G). Presence of brain metastases was examined by fluorescent microscopy ( n = 6/group). Representative photographs are shown. Bars: 1 mm (H).
I ADAM8 expression in distant metastases of breast cancer patients ( n = 56) was analyzed by immunohistochemistry. Representative pictures and percentages of ADAM8-positive samples are presented.
