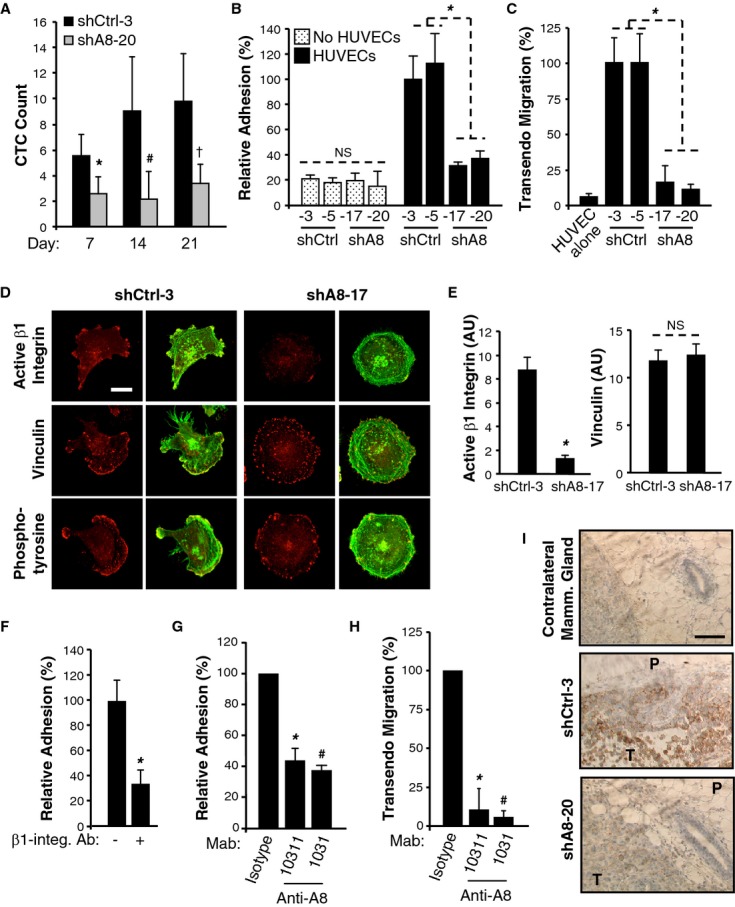
Figure 6.

A Blood was drawn using the submandibular collection method from 4 mice/group on the indicated days after tumor cell implantation into the MFP and subjected to flow cytometry to measure GFP-positive CTCs. Average count for the 4 mice ± s.d. per μl of blood is given for each time point. * P = 0.03, # P = 0.05, † P = 0.02, Student's t-test.
B Cells were incubated, in duplicate, on a HUVEC monolayer or in empty wells. Attached cells were counted in three fields per well. Mean ± s.d. from three independent experiments. NS, non significant, * P = 1.6E-6, Student's t-test.
C Cells were subjected to an overnight transendothelial migration assay on HUVECs. Mean ± s.d. from three independent experiments. * P = 1.7E-5, Student's t-test.
D, E Cells were plated on fibronectin-coated coverslips, stained with antibodies against active β1-integrin, vinculin or phosphotyrosine (focal adhesions markers) and phalloidin-488 (F-actin). Confocal microscopy images show adhesion protein channel (red) or merge with F-actin (green). Bar: 10 μm (D). Signal intensity for active β1-integrin and vinculin was determined using ImageJ software (arbitrary units). Mean intensity ± s.d. from >20 cells over 2 experiments. * P = 1.4E-4, NS, non significant, Student's t-test (E).
F Adhesion of shCtrl-3 cells on HUVECs was assessed as in (B) with prior incubation of shCtrl-3 cells with an antagonist β1-integrin antibody (+) or a control isotype (−). Mean ± s.d. from three independent experiments. * P = 3.0E-5, Student's t-test.
G, H Adhesion (G) and transendothelial migration (H) of shCtrl-3 cells on HUVECs was assessed as in B and C, respectively. Prior to the assays, shCtrl-3 cells were incubated either with monoclonal antibodies targeting the ectodomain of ADAM8 (Mab10311 or Mab1031) or an appropriate isotype control (IgG1 or IgG2B, respectively). The transmigration assay was performed for 9 h. Mean ± s.d. from three independent experiments. * P = 0.001, # P = 5.0E-4, Student's t-test (G). * P = 6.3E-7, # P = 4.0E-7, Student's t-test (H).
I Active β1-integrin expression was assessed by immunohistochemistry in mouse mammary tumors (shCtrl-3 and shA8-20) and contralateral mammary glands (shCtrl-3) ( n = 7/group). P: Peritumoral area, T: Tumor. Bar: 100 μm.
