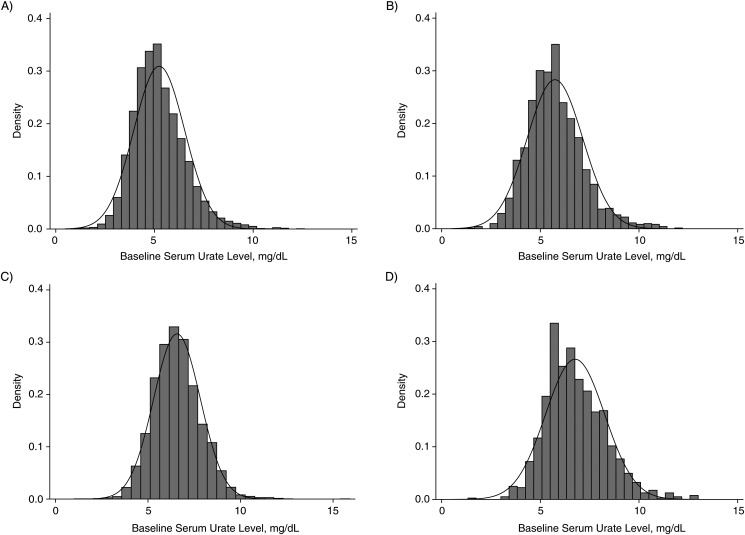
Figure 3.
Distribution of serum urate (in mg/dL) at cohort entry (1987–1989) in the US-based Atherosclerosis Risk in Communities Study by race and sex. The density of serum urate levels at cohort entry (baseline) and normal distribution were plotted by race and sex for A) white women; B) white men; C) black women; and D) black men.

