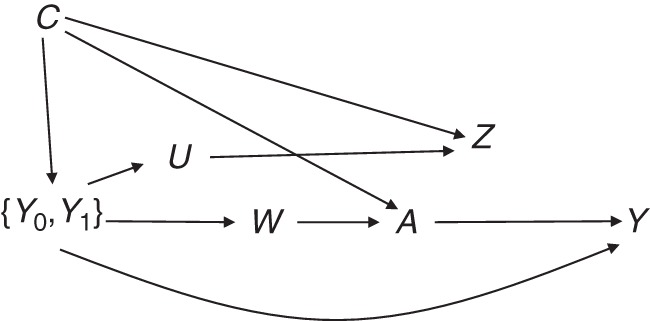
Figure 2.

Causal diagram depicting unobserved confounding by U and W and the negative control outcome Z, where A represents exposure; Y represents outcome; U and W represent unobserved predictors of Z and A, respectively; C represents observed confounders; and {Y0, Y1} are counterfactual outcomes for different exposure values.
