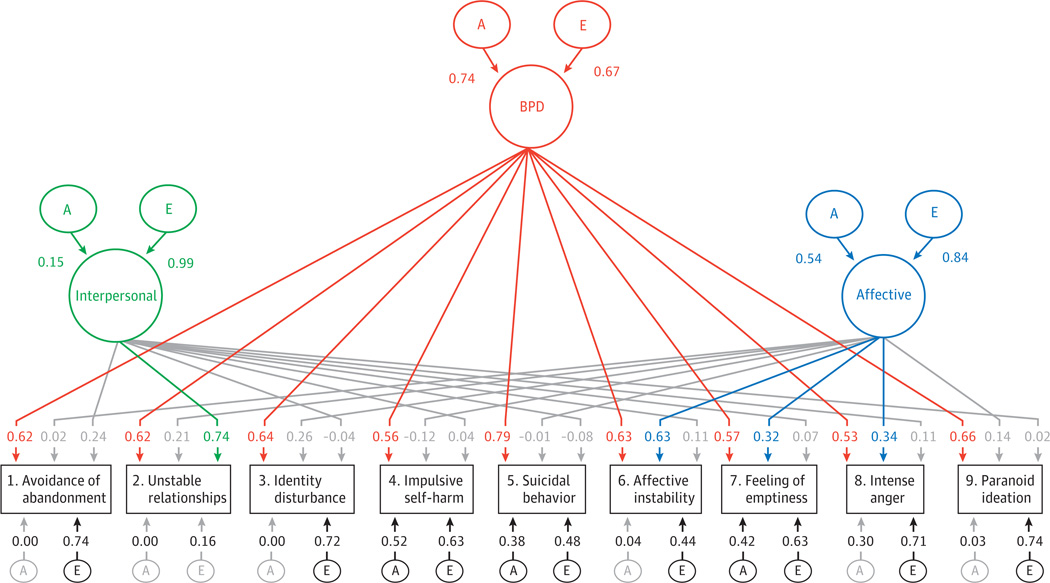
Figure. Genetic and Nonshared Environmental Parameter Estimates From the Best-Fitting Model for the 9 DSM-IV Criteria for BPD.
Values represent path coefficients, which need to be squared to calculate the proportion of variance in liability accounted for by the latent variables. Paths with values of 0.32 or greater (accounting for 10% or more of the phenotypic variance) from the 3 common latent factors are shown in green, red, and blue. Criterion-specific paths are shown in black. Paths not exceeding 0.32 are depicted in gray. A indicates additive genetic effects; BPD, borderline personality disorder; E, nonshared environmental effects.

