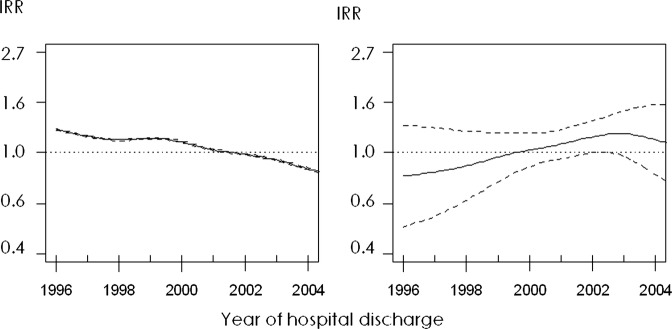
Figure 2.

Time series of incidence analysed using non-parametric generalised additive models. Left plot: smoothed series adjusted for age and sex. Right plot: smoothed series adjusted for age, sex, prevalence of smoking, obesity and overweight, and use of cardiovascular disease prevention drug therapy. Solid lines represent the incidence rate ratios (IRRs) and dashed lines are the upper and lower limits of its 95% CI.
