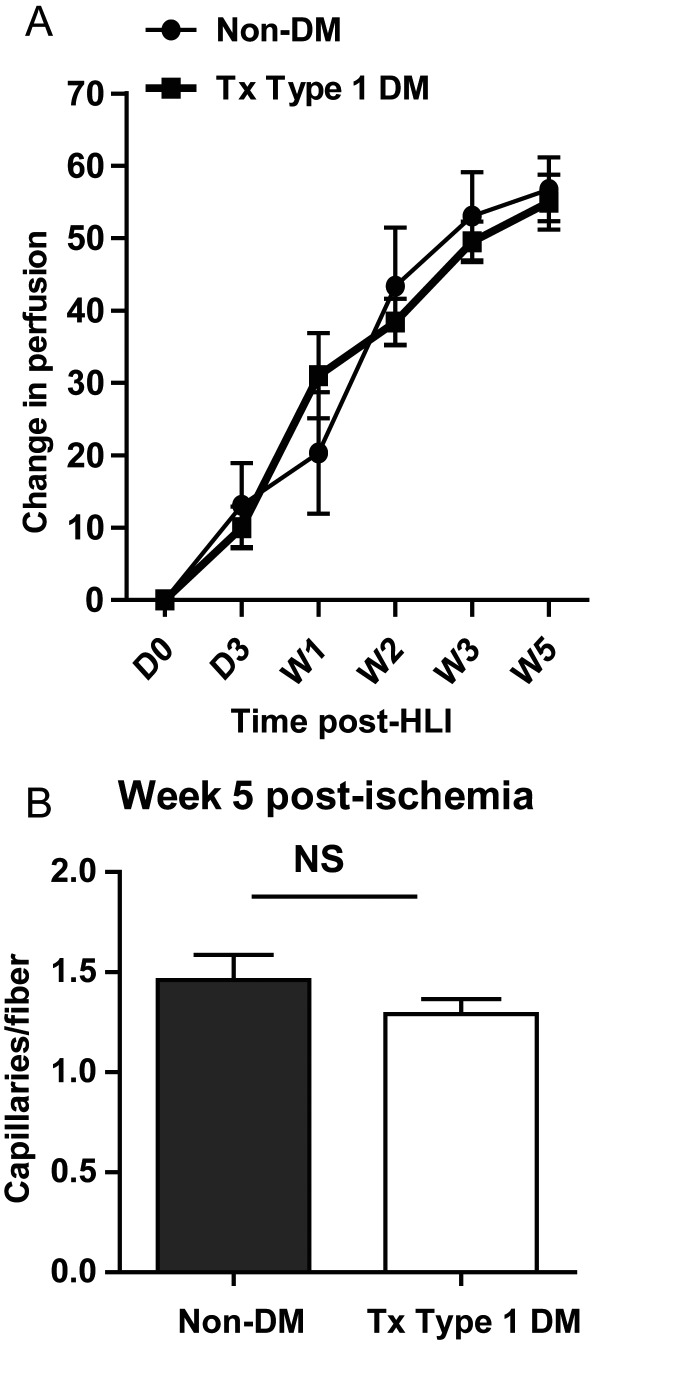
Figure 3.
(A) Perfusion recovery in treated Type 1 DM mice (n = 21) is comparable with that of non-diabetic controls (n = 8–12). The Y-axis shows the perfusion ratio (ischaemic-to-non-ischaemic limb) normalized to values immediately post-surgery. The X-axis shows the time point at which perfusion was assessed (P > 0.05) at all time points. (B) Capillary density in Week 5 post-ischaemic hind limb muscles of treated Type 1 DM mice (n = 10) is comparable with that of non-diabetic controls (n = 7, NS, P > 0.05).

