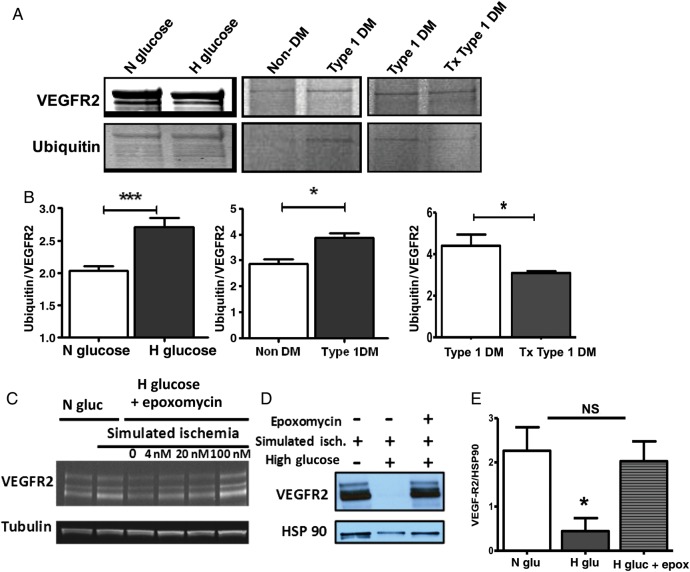
Figure 6.
(A) VEGFR2 immunoprecipitation followed by anti-ubiquitin western blotting reveals higher VEGFR2 ubiquitination in HUVECs exposed to simulated ischaemia in the setting of high glucose compared with those in the setting of normal glucose (left panel). In vivo, VEGFR2 ubiquitination is higher in ischaemic hind limbs from Type 1 DM mice (middle panel). Insulin treatment results in reduced VEGFR2 ubiquitination in ischaemic hind limbs of Type 1 DM (Tx Type 1 DM, right panel). (B) Ubiquitin-to-VEGFR2 ratio from quantization of VEGFR2 band represented in A (left panel, n = 3 for N glucose and 4 for H glucose, ***P = 0.006; middle panel, n = 3 for non-DM and 4 for Type 1 DM, *P = 0.01; right panel, n = 5 for Type 1 DM and 4 for Tx Type 1 DM, *P = 0.04). (C) Blocking ubiquitin–proteasome degradation with epoxomycin restores VEGFR2 expression in simulated ischaemia in a dose-dependent manner. (D) Representative blot showing VEGFR2 expression in simulated ischaemia restored with epoxomycin treatment. (E) Quantification of the bands in D (N Gluc = normal glucose, H Gluc = high glucose, Epo = epoxomycin, n = 3, *P < 0.05, NS = not significant). Each blot is representative of at least three experiments.

