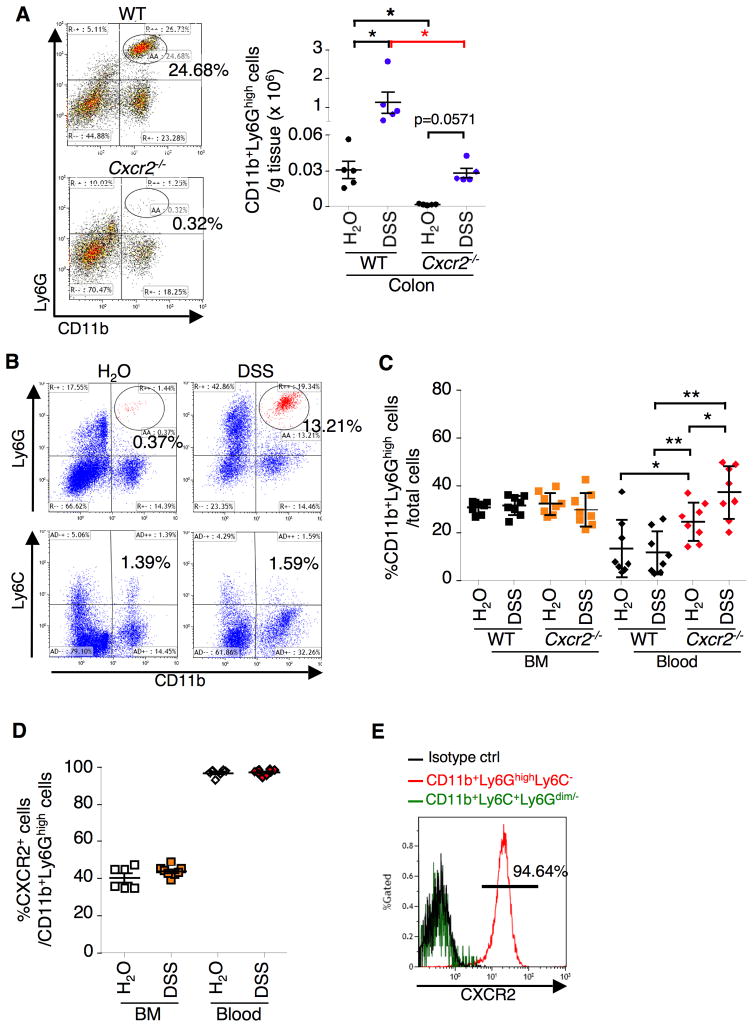
Figure 2. Loss of CXCR2 inhibits DSS-induced a massive infiltration of MDSCs from circulatory system to colon.
The indicated genotypic mice aged 8 weeks were treated with 4 cycles of 1.25% DSS and the cells isolated from indicated organs were subjected to Flow Cytometry analysis. Viable granulocytes/monocytes or total cells were gated in a FSC/SSC plot. (A) The subpopulation of G-MDSCs in colonic mucosa was represented as percentage of gated granulocytes/monocytes cells (left panel) or as the numbers of G-MDSCs per gram of each mouse colon tissue (right panel). Each dot in the right panel represents the numbers of G-MDSCs in colonic mucosa taken from one mouse. (B) The profiles of G-MDSCs and monocytic MDSCs in colonic mucosa of water- or DSS-treated WT mice as mentioned above. (C) Data represents the percentage of G-MDSC in total viable cells from bone marrow (BM) and peripheral blood taken from mice. (D) Data represents the percentage of CXCR2+ MDSCs in total G-MDSCs from BM and blood in WT mice. (E) The percentage of CXCR2+ G-MDSCs and monocytic MDSCs in total G-MDSCs and monocytic MDSCs. The error bar indicates ± SEM. *p<0.05, ** p<0.01. See also Figure S1.

