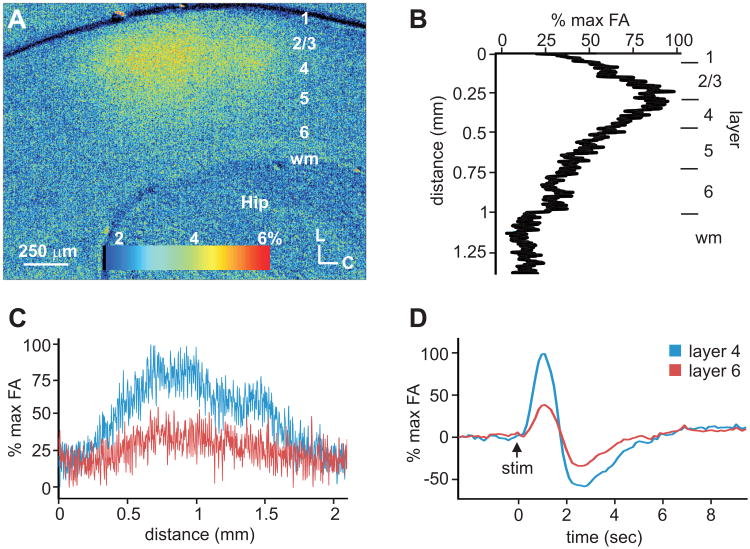
Fig. 3.
Areal and laminar activation pattern of flavoprotein autofluorescence (FA) in auditory cortex (A1) following electrical stimulation of the MGB. (A) FA image of A1 at the time of maximal autofluorescence following thalamic stimulation. (B) Laminar FA profile in A1 at the time of maximal autofluorescence. (C) Areal profile of FA responses across layers 4 and 6. (D) Time course of cortical FA response in layers 4 and 6 of A1.

