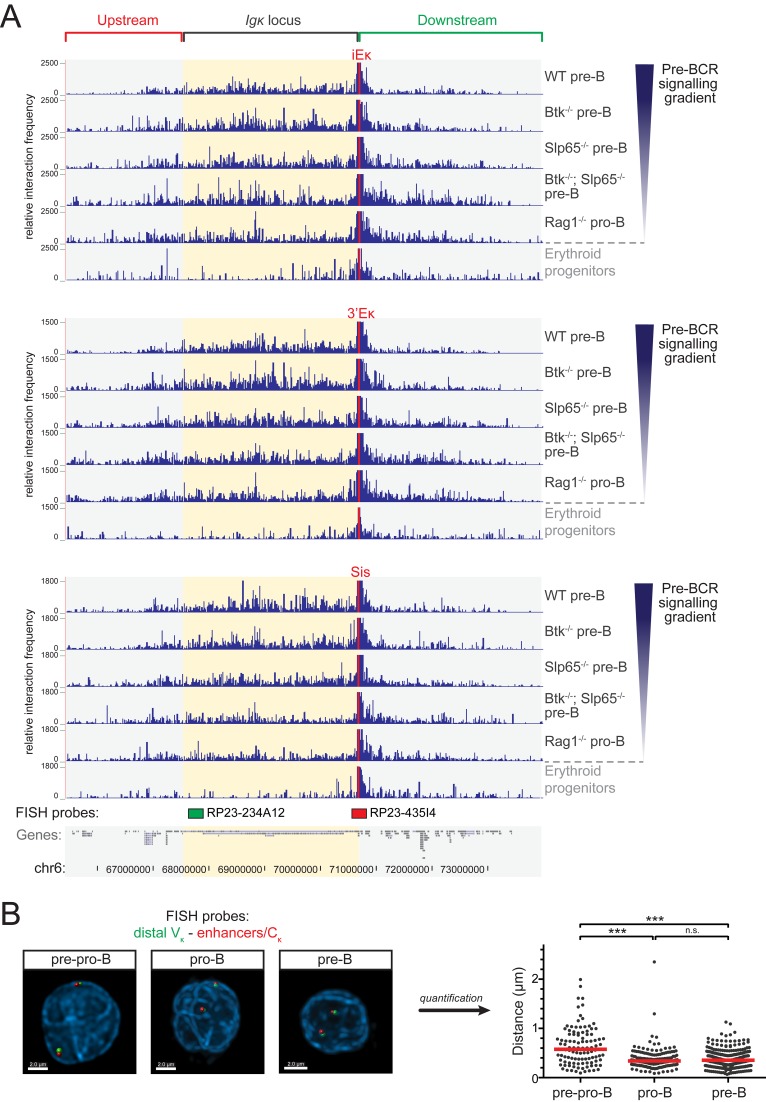
Figure 3. 3C-Seq analysis of long-range chromatin interactions within the Igκ locus and flanking regions.
(A) Overview of long-range interactions revealed by 3C-Seq experiments performed on the indicated cell fractions, representing a gradient of pre-BCR signaling, whereby the iEκ element (top), the 3′Eκ element (center), or the Sis element (bottom) was used as a viewpoint. Shown are the relative interaction frequencies (average of two replicate experiments) for the indicated genomic locations. The ∼8.4 Mb region containing the Igκ locus (yellow shading) and flanking regions (cyan shading) is shown and genes and genomic coordinates are given (bottom). The locations of the two BAC probes used for 3D DNA-FISH are indicated by a green (distal Vκ probe) and red (proximal Cκ/enhancer probe) rectangle (bottom). Pre-B cell fractions were FACS-purified from the indicated mice on a VH81x transgenic Rag1 −/− background (see Figure 1 for gating strategy). Erythroid progenitor cells were used as a nonlymphoid control. (B) 3D DNA-FISH analysis comparing locus contraction in cultured bone-marrow–derived E2a −/− pre-pro-B, Rag1 −/− pro-B, and VH81x Rag1 −/− pre-B cells (see Figure S6 for phenotype of IL-7 cultured B-lineage cells). Locations of the BAC probes used are indicated at the bottom of panel A. Representative images for all three cell types are shown on the left, quantifications (>100 nuclei counted per cell type) on the right. The red lines indicate the median distance between the two probes. Statistical significance was determined using a Mann–Whitney U test (***p<0.001; n.s., not significant, p≥0.05).

