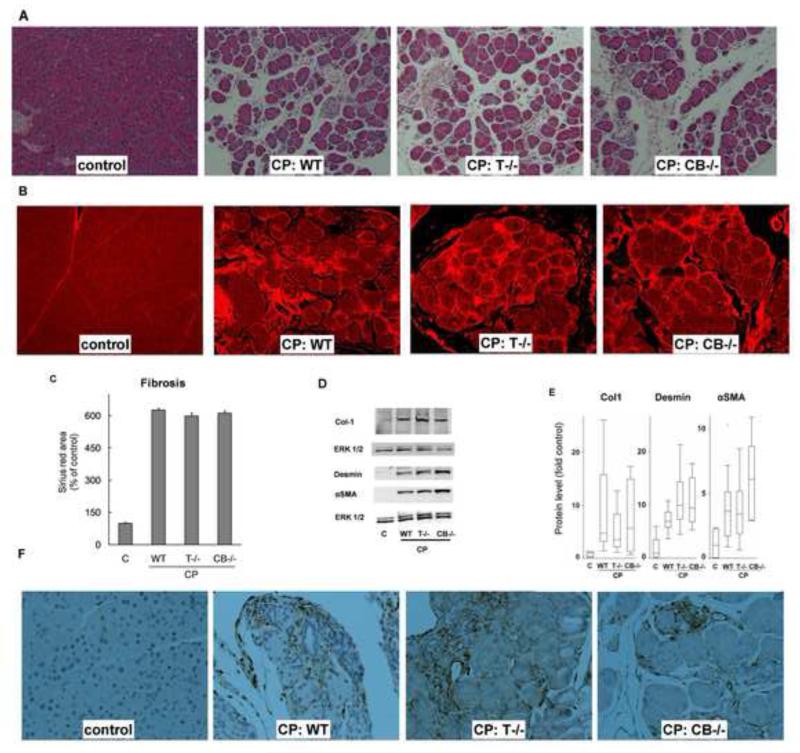
Figure 3. (A) Histologic features characteristic of chronic pancreatitis were similar in all experimental CP groups.
Representative hematoxylin and eosin-stained sections (100×) showing moderate acinar loss, fibrosis, microscopic duct dilatations, tubular complexes and inflammatory infiltrate WT, T−/− and CB−/− CP groups (N=16-20/group). (B) Fibrosis: Sirius red-stained sections (100×) under fluorescence showing marked fibrosis in CP groups. Quantification (C) confirmed comparable fibrosis in WT, T−/− and CB−/− CP groups (P<.0001 pair wise for each CP group vs control, not significant pair wise among CP groups, N=16-20/group). (D,E) Comparable overexpression of collagen-1, desmin and αSMA in CP groups. Representative western blots are shown in (D) and their quantification is shown as box-whisker plots with outliers in (E). N=5-8/group for each protein. Control vs WT, T−/−, CB−/− CP groups respectively: P= .0008, .001, .04 for collagen-1; .001, .001, .009 for desmin and .001, .001, .009 αSMA. P-values not significant for all pair wise comparisons among CP groups. Vimentin staining confirmed marked increase in stellate cell population in the CP groups (F). Representative sections (200×) stained with vimentin are shown.

