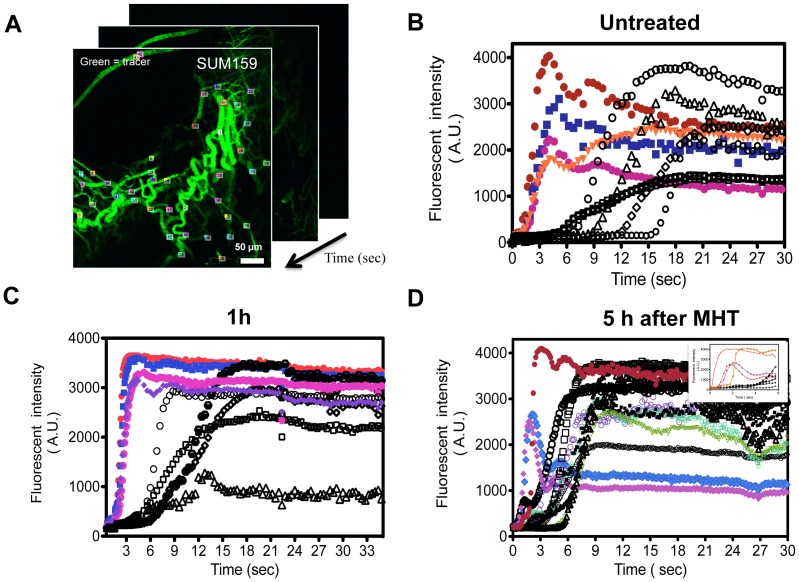
Figure 4. MHT treatment increases tumor dynamic flow as characterized by dye perfusion.
A) Representative ROIs selected for time-lapse fluorescence analyses in SUM159 tumor. ROIs were randomly defined inside arterioles, venules and capillaries, between branching points, yielding approximately ∼40 ROIs per video; B) Perfusion curves of untreated SUM159 tumor with arterial (colored) and venous perfusion (black) characterized by rapid arteriole flow and delayed venous flow; C) Altered perfusion plots of MHT treatment group characterized by steeper and more rapid arteriole flow and shortened venous flow; D) tabulated summary shows by shortened dextran half-life and AVTT where ± represent standard deviations in ∼120 ROIs from n = 6 with statistical significance denoted by * p<0.033 at 5 h after treatment relative to untreated group. The videos from which the data have been derived are found in supplementary data.

