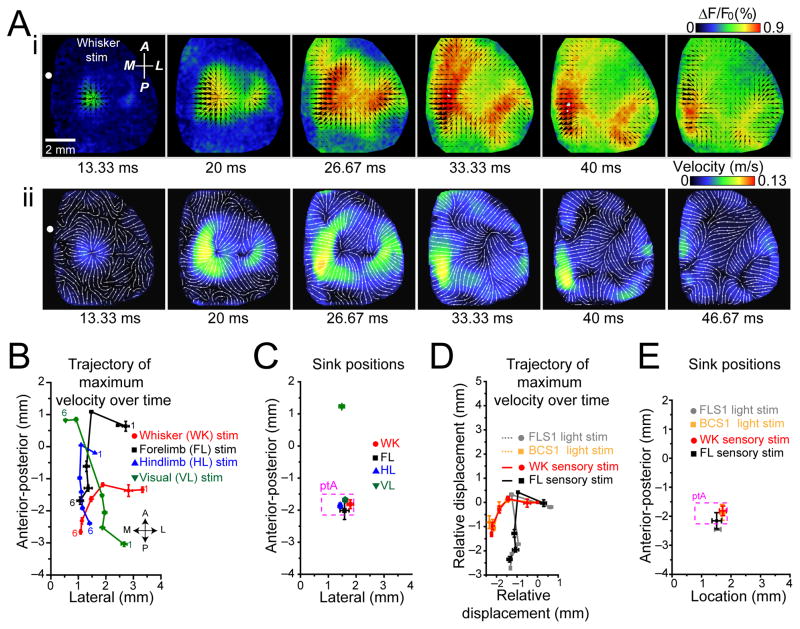
Figure 2. Sensory and photostimulation-induced activation exhibit modality specific source locations and termination at a common sink location.
(A)(i) Whisker stimulation-evoked VSD activation (average of 20 trials). Black arrows indicate the direction of velocity of VSD signal spread. Relative magnitude of velocity is indicated by arrows size. (ii) For response in (i), measurements of absolute velocity are represented in pseudocolor. Streamlines indicate local direction of velocity flow. (B) Position of maximum velocity (center of mass) of VSD signal spread from sensory stimulation following initial activation on cortex relative to bregma at six 6.67 ms intervals indicated as 1 to 6. Bregma is at coordinate (0,0). (C) Position of sink locations for each sensory modality plotted on cortex relative to bregma. All forms of sensory stimulation shared a common sink location within parietal association area (ptA), dotted box (p>0.05, n=8 mice). Visual stimulation resulted in an additional, sink location within anterior medial cortex (***p<0.001, n=8 mice). (D) Positions of maximum velocity of VSD signal spread following sensory (forelimb and whisker) and photostimulation (FLS1 and BCS1). Maximum velocity positions for each trajectory were normalized to their initial positions. Trajectories from sensory stimulation and photostimulation were similar (p>0.05, for sensory versus photostimulation of the same of modalities, n=7 mice). (E) Positions of sink locations for sensory and photostimulation-induced activation plotted on cortex relative to bregma. Sink locations between sensory-evoked and photostimulation induced activation were similar (p>0.05 for all comparisons, n=7 mice). Error bars represent s.e.m.

