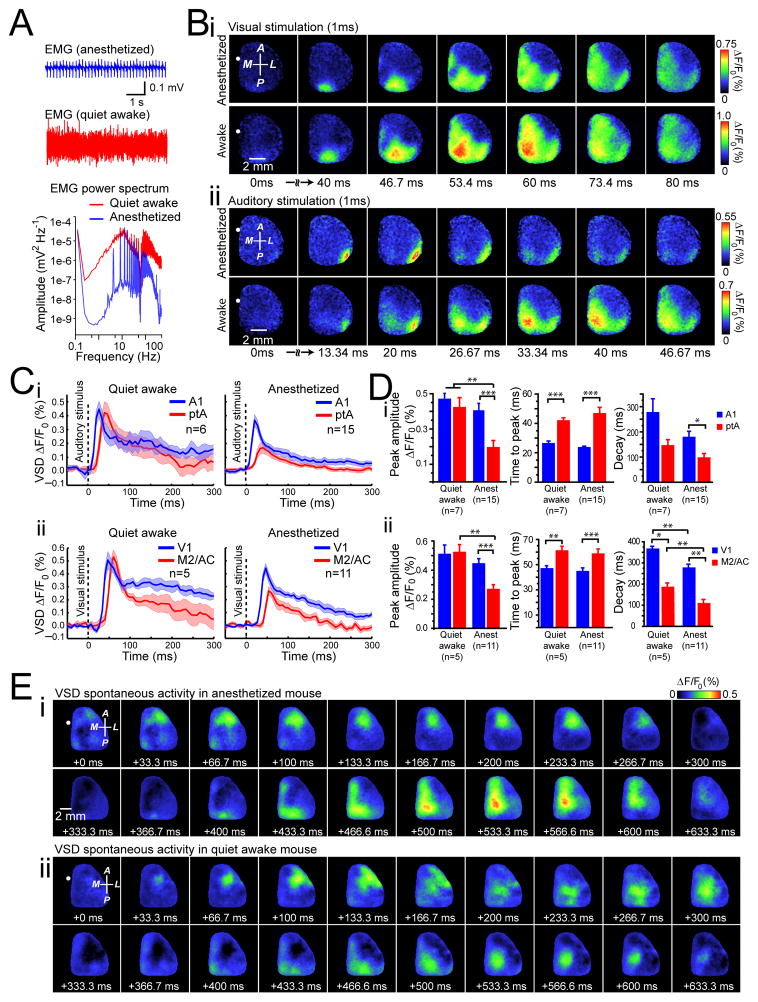
Figure 4. Patterns of sensory-evoked and spontaneous activity in quiet awake mice are similar to those observed under anesthesia.
(A) Individual example of neck muscle electromyography (EMG) (>1 Hz) from a head-restrained mouse under isoflurane (0.5%) anesthesia (top trace), or 1 h after awakening (bottom trace). The power spectrum of the EMG signals show different spectra between states of anesthesia (blue) and wakefulness (red). (B) Representative cortical VSD signals in response to contralateral (i) visual or (ii) auditory stimulation during anesthesia (top panel) or in quiet awake states (bottom panel). Images represent the average of 10 trials of stimulation. Note that responses are scaled differently. (C) Quantification of VSD signals to (i) auditory stimulation or (ii) visual stimulation in anesthetized (right panels) or quiet awake states (left panels). Plots are average of VSD signals measured from 5 × 5 pixel boxes (~ 0.11 mm2) placed within (i) A1 (blue traces) and ptA (red traces) for auditory stimulation, or (ii) V1 (blue traces) and M2/AC (red traces) for visual stimulation. (D) Statistical quantification of peak amplitude (left panels), time to peak (center panels), and decay (right panels) of the (i) auditory-evoked or (ii) visual-evoked VSD responses during anesthesia or quiet awake states. (E) Representative montages showing two distinct time epochs (each 633.3 ms) of VSD imaging of spontaneous cortical activity during (i) anesthesia, (ii) or in a quiet awake states. Position of bregma marked as white circle. Compass arrows indicate anterior (A), posterior (P), medial (M) and lateral (L) directions. Error bars represent s.e.m.

