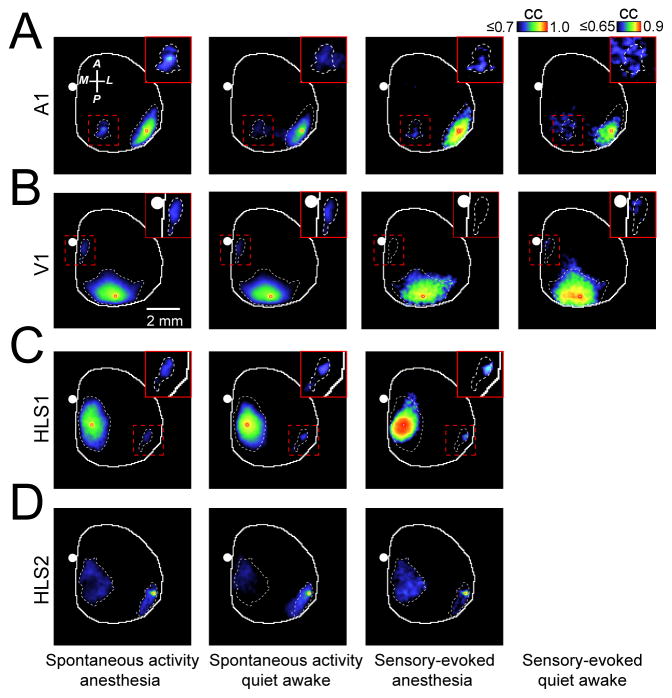
Figure 5. Correlation maps generated from sensory-evoked or spontaneous activity during quiet wakefulness are similar to maps obtained during anesthesia.
(A) Representative correlation maps generated from a seed-pixel from primary auditory cortex (A1) calculated from 300s of cortical spontaneous activity in isoflurane induced anesthesia (1st column from left), quiet wakefulness (2nd column from left) or after auditory stimulation in anesthetized or quiet awake states (3rd and 4th column from left respectively). Inset images represent magnification of area denoted by dashed red box and were all re-scaled to the right calibration bar. (B–D) Similar to A, the correlation maps were calculated within primary visual cortex (V1) (B), primary representation of hindlimb somatosensory cortex (HLS1) or secondary representation of hindlimb somatosensory cortex (HLS2) (C, D). CC denotes correlation coefficient. Position of bregma marked as white circle. Compass arrows indicate anterior (A), posterior (P), medial (M) and lateral (L) directions. See Supplementary Fig. 7 for group data analysis.

